QC09 showed how to measure the difference between two methods. This article asks the next question: who decides whether that difference is acceptable, what evidence supports the limit, and is the limit right for the clinical use of the result?
1. When a Method Passes QC but Still Raises Questions
A method can pass every QC rule and still be unfit for its clinical purpose. In QC09, a method comparison showed a systematic difference between two haemoglobin methods. The statistics described that difference well, but they could not say whether it was acceptable.
That judgement needs a criterion set before the data are examined: an analytical performance specification (APS). The Milan framework defines an APS as a numerical criterion for the analytical quality needed for laboratory information to meet clinical needs [1]. Laboratories use APS when they select, validate or verify a method, assess a new reagent lot, and monitor performance in IQC and EQA [1].
Internal QC cannot make this judgement for us. IQC monitors stability around a target. If the target was set from the laboratory's own data, any bias present at that time is built into it. Even with assigned values, control material may not behave like patient blood. Passing IQC shows that the method is behaving as it did; it does not show that patient results are accurate enough (QC Articles 01–05).
This article asks three questions of any acceptance limit:
- Who set it, and for what purpose?
- What evidence supports it?
- Is it appropriate for the result we are evaluating?
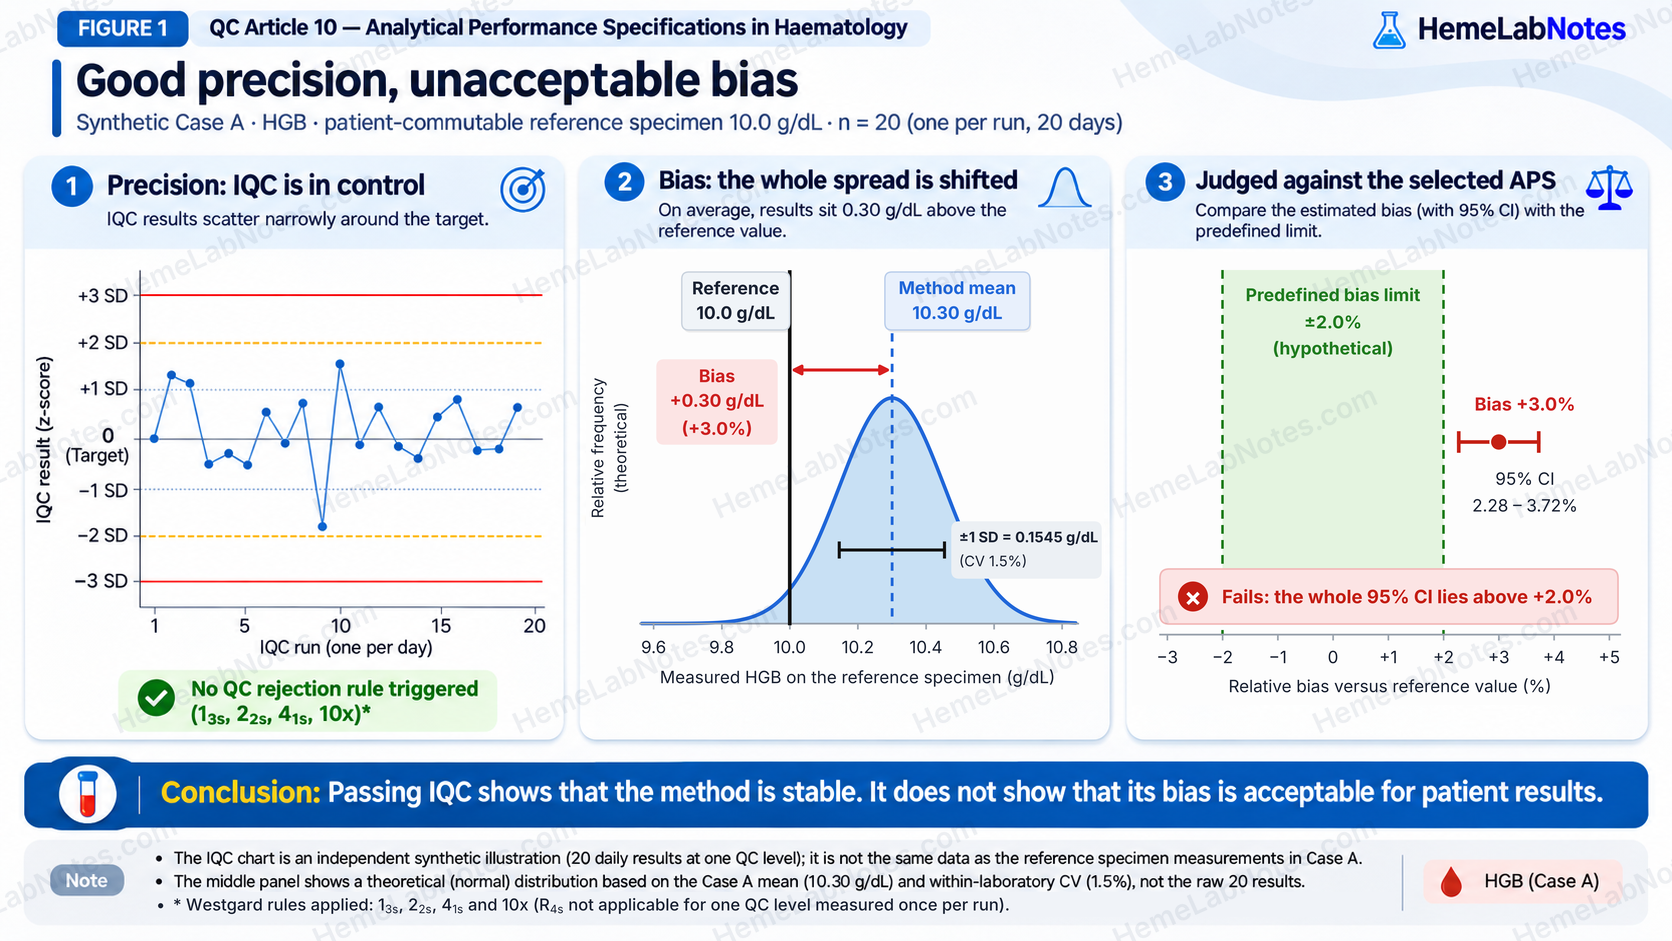
An independent synthetic IQC sequence shows no selected rejection-rule violation, while Case A separately demonstrates bias exceeding a predefined hypothetical ±2.0% limit. Passing IQC does not establish acceptable bias in patient results.
View full sizeAll numerical cases in this article are synthetic and for teaching only. They do not represent any analyser, EQA scheme or regulatory decision.
2. What an APS Actually Specifies
An APS is a requirement placed on one performance characteristic; an allowable total error (TEa) is only one way of writing such a requirement. Four characteristics recur in haematology method evaluation.
| Characteristic | What it describes | Typical expression | In this series |
|---|---|---|---|
| Imprecision | Random scatter of repeated results | CV (%) or SD | QC02 |
| Bias | Systematic difference from a reference or comparison value | % or measurement units | QC09 |
| Total error (TE) | Combined effect of bias and imprecision on a single result, under a chosen model | e.g. |bias| + 1.65 × CV | This article (illustrative) |
| Measurement uncertainty (MU) | Dispersion of values reasonably attributed to the measurand, from all significant sources | Standard or expanded uncertainty | QC11 |
Three consequences follow.
The same evidence can produce specifications for different characteristics. Biological variation (BV) data, for example, yield APS for imprecision, bias, total allowable error and allowable MU [2]. A figure such as "2.8%" means nothing until we know which characteristic it constrains.
TE is a model, not a measurement. The common formula adds |bias| to a multiple of the CV. The multiplier (1.65, 1.96 or 2) reflects a chosen coverage, and the result estimates the error a single result might carry. CLSI EP46 sets out how allowable total error goals and limits are determined [3]. TE-based and MU-based approaches coexist, and ISO 15189:2022 requires MU evaluation where relevant [4, §7.3.4]. This article uses TE only as an illustrative model; QC11 turns to MU.
Choosing the evidence and choosing the error model are separate decisions. The 2015 Milan consensus describes how specifications should be derived. It does not prescribe an error model such as TE or MU [5].
3. The Milan Models: Allocation, Evidence and Fallbacks
The three Milan models are three kinds of evidence for an APS. How strictly they should be ranked has been described differently over time; this article presents that evolution rather than settling it.
From Stockholm to Milan
The 1999 Stockholm consensus set out a hierarchy of approaches for setting quality specifications [6]. In 2014, the 1st EFLM Strategic Conference in Milan simplified it into three models [5]:
- Model 1 — clinical outcomes. Direct studies of how analytical performance affects patient outcomes (1a), or indirect studies of its effect on clinical classification and decisions, for example by simulation (1b).
- Model 2 — biological variation. Analytical noise should be small relative to the biological signal within and between individuals.
- Model 3 — state of the art. The highest performance technically achievable, or the performance achieved by a stated proportion of laboratories.
The consensus called this a simplified hierarchy and gave preference to Models 1 and 2. It also said that the intended use, the stakeholder applying the APS and the quality of the evidence may modulate the choice; that some models suit some measurands better; and that models may be combined [5]. Every proposed APS should come with its rationale, its source and the quality of its evidence [5]. That requirement is the backbone of this article.
Allocation: where haematology measurands sit
An EFLM task group published criteria for allocating measurands to the models in 2017 [7]. Model 1 applies when a measurand has a central role in clinical decisions with established cut-offs; Model 2 when its concentration is in a steady state; Model 3 when neither applies.
Haemoglobin, platelets and neutrophils were placed in Model 1 because of their decision limits [7]. The limits the authors summarised include anaemia diagnosis, red cell transfusion at about 70–80 g/L (7–8 g/dL) depending on the clinical situation, and platelet transfusion thresholds of 10, 20, 50 and 100 ×10⁹/L for different clinical settings, based on the guidelines current at the time [7]. Current guidance is cited in Section 5. RBC, HCT and MCV were placed in Model 2, and so was haemoglobin when it is used for monitoring [7]. The same measurand can therefore need different specifications for different clinical uses.
Model 1 works best where a complete reference measurement system exists, because an allowable bias can then be stated in absolute terms [7]. Haemoglobin is well placed: it has an ICSH reference method, the haemiglobincyanide (HiCN) method [8], so a bias can be judged in g/dL at a decision level.
Two cautions apply to the allocation. The authors answered only the first question in their workflow; they did not evaluate whether outcome or BV data actually exist for each measurand [7]. And their workflow sends a Model 1 measurand without valid outcome data temporarily to Model 3 [7].
Fallbacks in practice
Later work did not always follow that route. Braga and Panteghini kept blood haemoglobin in Model 1 and proposed a desirable MU specification for it [9]. Braga et al. found no outcome-based data for platelets and temporarily reallocated them to the BV model instead [10]. Both choices are defensible, and they differ. This is the article's central point in miniature: someone decides, and the decision should be visible.
From allocation to all the evidence
A 2024 paper from an EFLM task group describes the Milan models as non-hierarchical [11]. Jones et al. propose that, even after a measurand has been allocated, information from all three models should be considered, using a risk-based approach that reflects the test's role in its clinical pathway [1]. In haematology this means outcome-type reasoning at decision levels, BV data where a steady state applies, and state-of-the-art data to show what current methods can achieve.
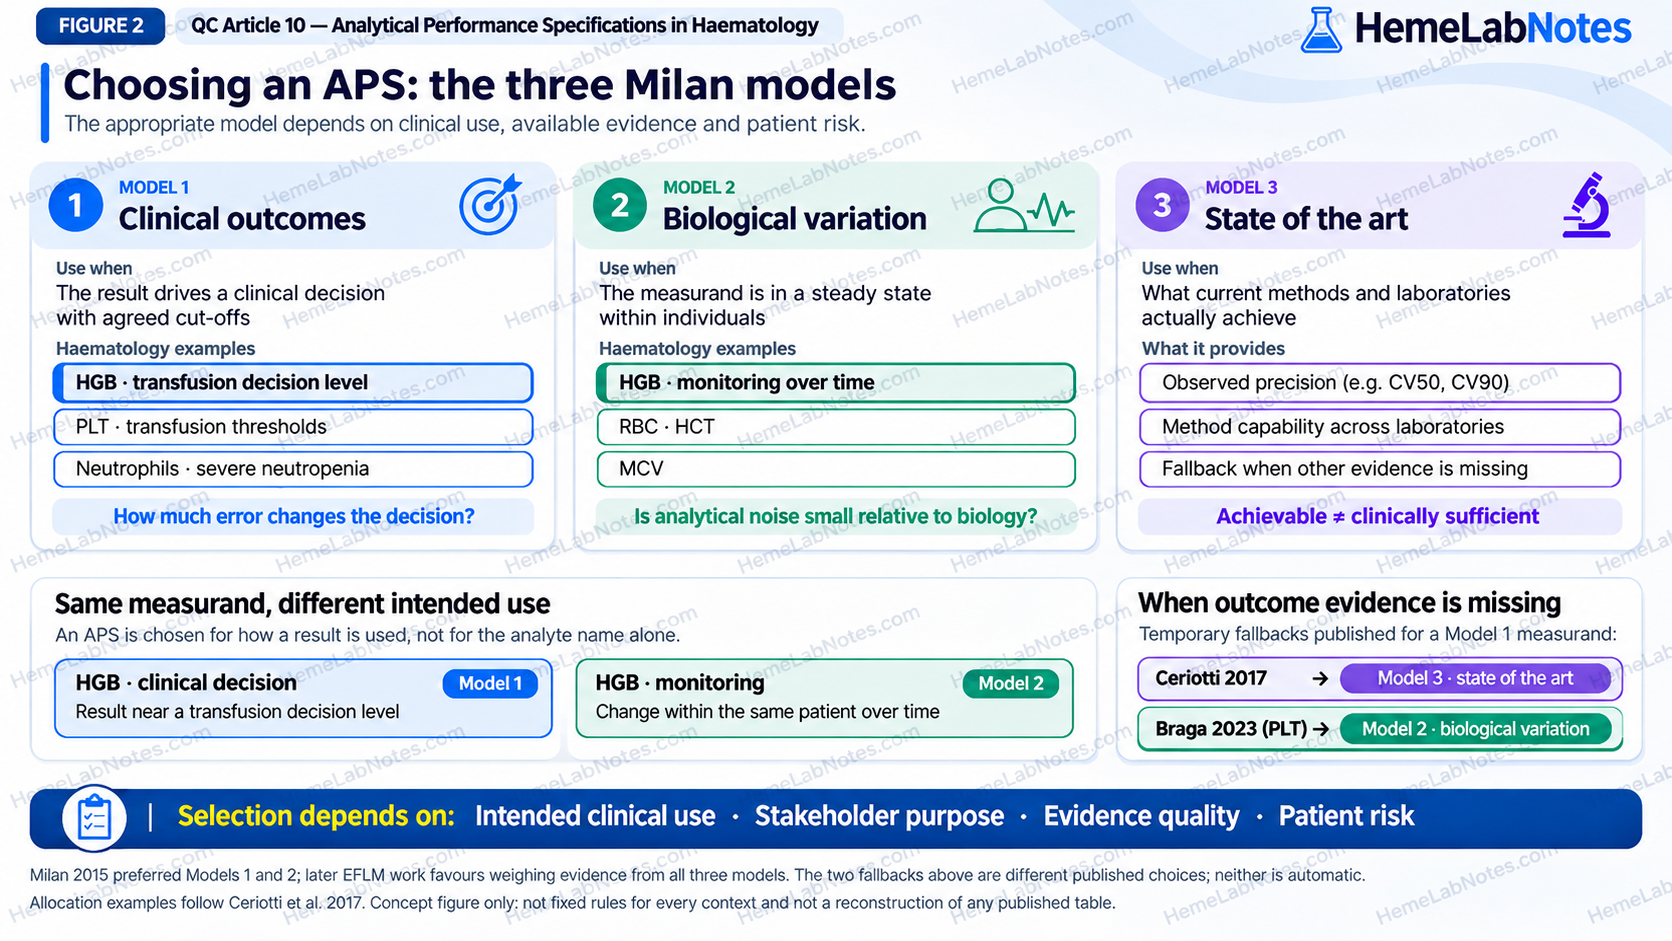
The Milan models draw on clinical outcomes, biological variation and state-of-the-art performance. Selection depends on intended clinical use and available evidence; published fallback approaches differ and are not automatic rules.
View full size4. Where Acceptance Limits Come From — and Why They Disagree
Acceptance limits disagree mainly because they were built for different purposes. A limit derived from biology, a limit describing what laboratories achieve and a limit for grading one EQA result answer different questions.
| Source | Basis | Question it answers | Main caution |
|---|---|---|---|
| Outcome-based studies | Milan Model 1 | How good must results be to avoid harmful misclassification? | Few exist for haematology [10]; simulations need clinical judgement to weigh outcomes [7,11] |
| EFLM Biological Variation Database | Milan Model 2 | How small should analytical noise be relative to biology? | Depends on reliable BV estimates and a steady state [2] |
| State-of-the-art data | Milan Model 3 | What can current methods achieve? | Achievable does not mean clinically sufficient [5] |
| Regulatory PT criteria (e.g. CLIA) | Acceptance limit around a PT target | Is this single PT result acceptable? | Grades one result against one target; not a bias specification |
| EQA scheme limits | Scheme-specific | Is the laboratory's EQA performance acceptable? | Purpose and basis vary between schemes (QC08) |
| Professional guidance (CLSI EP46) | Consensus framework | How should allowable total error goals and limits be set? | A method for setting limits, not a ready-made value for every measurand [3] |
Biological variation
The EFLM Biological Variation Database publishes quality-appraised BV estimates and calculates BV-based APS from them [2,12]. HemeLabNotes cites the database rather than reproducing its values. BV-based APS depend on accurate and relevant BV estimates. They assume a steady state, and may not suit disease states, every concentration range or every clinical use [2,5].
State of the art: what Gras et al. add
Gras et al. analysed IQC data from a 2020 interlaboratory database (Bio-Rad Unity). QC lots were included only if they were used on more than 20 analytical systems with at least 2000 QC results, and several hundred million results remained after exclusions [13]. For each analyte and concentration level, the authors reported the median CV achieved by laboratories at the 50th, 90th and 95th percentiles (CV50, CV90 and CV95) [13].
Two findings matter for haematology. For haemoglobin at the lowest QC level (55.3–105.4 g/L), CV50 was 1.08% and CV90 was 2.13% [13]. For platelets, CV50 fell from 5.08% at 46.5–83.1 ×10⁹/L to 2.80% at 189.1–272.8 ×10⁹/L and 2.29% at the highest level [13]. Precision depends on concentration, and even the lowest platelet QC level is far above the transfusion thresholds where decisions are made.
The authors also report that, for some examinations, EFLM BV-based APS seem too stringent to be achieved with current methods [13]. The Milan consensus anticipated this gap. If the best laboratories cannot reach the quality that Models 1 or 2 require, the technology needs to improve [5]. A state-of-the-art figure therefore describes achievability; it does not show that the performance is safe for patients.
An earlier expert review also proposed state-of-the-art performance standards for routine haematology analysers, including platelet counts in the 10–20 ×10⁹/L range [14].
Regulatory PT criteria and EQA
Under the CLIA proficiency testing final rule, the acceptance limit for haemoglobin is the target value ±4%, tightened from ±7%. The revised rule took effect on 11 July 2024 and was implemented on 1 January 2025 [15–17]. An acceptance limit is a symmetrical tolerance around the PT target, applied to one reported result [15]. That target may be a peer-group mean rather than a reference value.
A PT limit therefore grades one result against one target. It is not a bias specification for method verification. The same applies to an EQA scheme's grading limit, although the performance data collected through EQA can support state-of-the-art analysis [7] (see QC08).
5. One Method, Different Specifications, Different Decisions
The same performance estimate can fail one limit and pass another. The three synthetic cases below show why the source of a limit matters as much as the data.
Case A — HGB at 10.0 g/dL: one estimate, three limits
| Assumption (synthetic) | Value |
|---|---|
| Assigned reference value of a hypothetical patient-commutable reference specimen | 10.0 g/dL, traceable to an appropriate reference measurement procedure (assignment uncertainty neglected for teaching) |
| Replicate measurements under within-laboratory conditions (one per run, on 20 separate days) | n = 20 |
| Mean of replicates | 10.30 g/dL |
| Within-laboratory CV | 1.5% |
| Estimated relative bias | +3.0% |
In this synthetic study, the value-assigned specimen is assumed to be commutable with patient blood, stable and homogeneous at 10.0 g/dL throughout the 20-day study, and traceable to an appropriate reference measurement procedure. Assignment uncertainty is neglected for teaching. In practice these properties must be demonstrated; they cannot be assumed for routine commercial IQC materials.
A CV of 1.5% is plausible but not best in class: it lies between the CV50 and CV90 that Gras et al. reported for haemoglobin at low QC levels [13]. If all 20 measurements came from a single run, the CV would describe repeatability rather than within-laboratory precision, and the CI below would understate the uncertainty.
The bias estimate has its own uncertainty. CV is relative to the measured mean and bias is relative to the reference value, so the SD is first converted to g/dL:
- SD = 10.30 × 0.015 = 0.1545 g/dL
- SE of the relative bias = 0.1545 ÷ (√20 × 10.0) × 100% = 0.3455%
- 95% CI = 3.0% ± 2.093 × 0.3455% = 2.28% to 3.72%
For a consistent illustrative total error, the SD is expressed on the same denominator as the bias. The 1.5% CV is relative to the measured mean of 10.30 g/dL, so the SD equals 1.545% of the 10.0 g/dL reference value. Under the one-sided 95% normal-error convention:
- Illustrative TE = |relative bias| + 1.65 × (SD ÷ reference value × 100%) = 3.0% + 1.65 × 1.545% = 5.549% ≈ 5.55%
This is a descriptive model comparison. It is neither a CLIA PT grading algorithm nor a universally prescribed method-verification rule.
| Limit | Type of source | Compared with | Result |
|---|---|---|---|
| Bias ±2.0% | Hypothetical, predefined by the laboratory | Bias 95% CI, 2.28–3.72% | Fails the predefined CI-based rule: the whole CI lies above +2.0% |
| ±7% | Historical CLIA HGB PT tolerance | Illustrative TE, 5.55% | Within the illustrative tolerance; not an actual PT result |
| ±4% | CLIA HGB PT tolerance from 2025 | Illustrative TE, 5.55% | Outside the illustrative tolerance; not an actual PT result |
Three safeguards apply to this table.
- It is not a PT result. CLIA grades a reported PT result against its target; it does not apply bias + 1.65 × CV. The table only shows how one performance estimate compares with tolerances of different widths.
- The single-result probability depends on a model. Suppose measured Hb is normally distributed with mean 10.30 g/dL and SD 0.1545 g/dL around an exact reference value of 10.0 g/dL. Relative to 10.0 g/dL, the error then has mean +3.0% and SD 1.545 percentage points, and about 25.9% of single measurements would fall outside ±4% of the reference value. This is a theoretical proportion, not an observed PT failure rate, and it ignores uncertainty in the estimated bias, SD and reference value.
- The bias failure is robust. The whole CI lies above +2.0%, so the conclusion is the same whether the predefined rule is "reject only if the bias is shown to exceed the limit" or "accept only if it is shown to lie within it". Section 6 shows a case where the two rules disagree.
Case B — HGB near a transfusion threshold
| Value | |
|---|---|
| Reference Hb | 6.90 g/dL |
| Calculated with +3% bias | 7.107 g/dL |
| Reported (one decimal place) | 7.1 g/dL |
| Example decision threshold | 7.0 g/dL |
A result that is truly below the threshold is reported above it. The example threshold matches the 2023 AABB international guidelines, which recommend considering transfusion below 7 g/dL in haemodynamically stable hospitalised adults [18]. This case is about decision classification, not a transfusion rule: a decision to transfuse depends on the patient, the applicable guideline and other findings.
The bias measured at 10.0 g/dL also cannot be assumed to hold at 6.9 g/dL. Proportional bias must be checked across the range, ideally with patient samples that cover the decision level, as in the QC09 method comparison.
Case C — PLT near 10 ×10⁹/L
Assume a nonbleeding adult with hypoproliferative thrombocytopenia receiving chemotherapy, in a pathway that uses a prophylactic transfusion threshold of 10 ×10⁹/L. The 2025 AABB/ICTMG guidelines recommend this threshold for this group; other patient groups have different recommendations [19]. Assume also integer reporting with conventional rounding and a +5% systematic bias.
| Calculated (×10⁹/L) | Reported (×10⁹/L) | Below 10? | |
|---|---|---|---|
| Without bias | 9.40 | 9 | Yes |
| With +5% bias | 9.87 | 10 | No |
A systematic error of only 0.47 ×10⁹/L changes the classification. In relative terms the bias is modest; its clinical consequence is not. This is what Model 1 adds: the consequence of an error does not scale with its percentage.
Random error matters here too. Assume an illustrative CV of 5% at this level. This is an assumption, not a measured value: the lowest platelet QC level in Gras et al. is several times higher than 9.4 ×10⁹/L, so it cannot show the CV of patient samples near the threshold [13]. A true count of 9.4 ×10⁹/L would then be reported as 10 or more in about 41.6% of measurements without bias, and in about 77.3% with a +5% bias. These are model results that assume normally distributed error, a 5% CV and integer rounding; they are not observed misclassification rates. Near a threshold, classification is a probability even when there is no bias; bias shifts the odds. That is why outcome-based (Model 1b) work focuses on what misclassification rate is clinically acceptable [11].
A 5% CV and a +5% bias are different performance characteristics, and neither can stand in for the other.
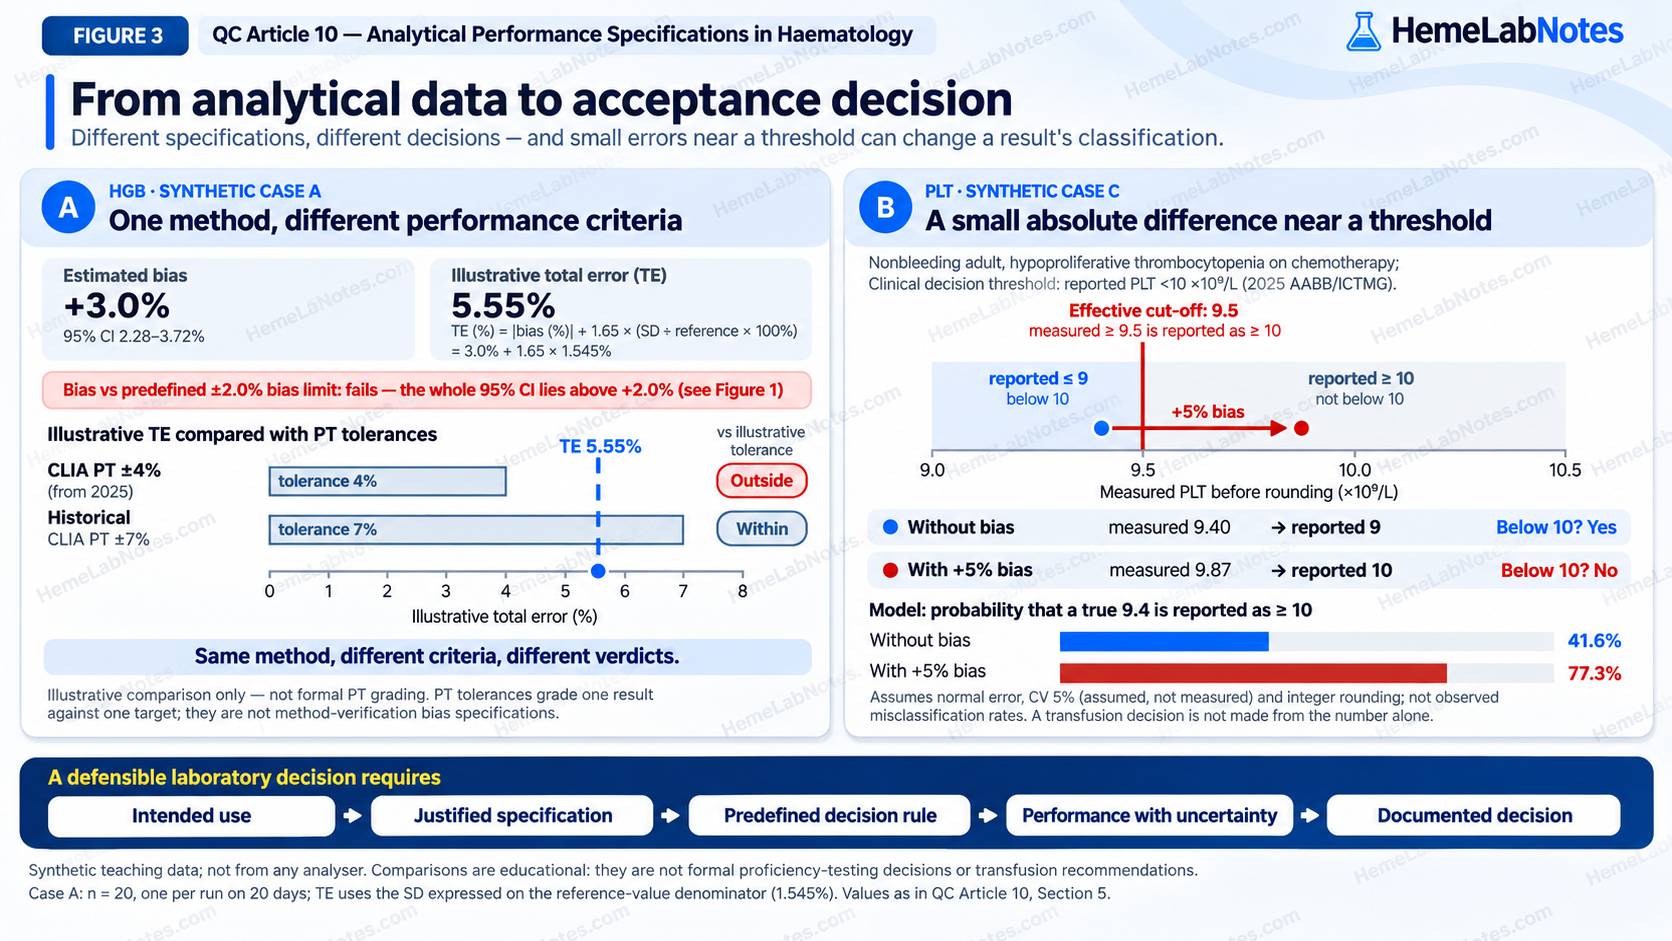
Synthetic examples distinguish HGB bias assessment from illustrative total-error comparisons with PT tolerances, and show how bias and random error can affect platelet classification near a reporting threshold. These are not formal PT grading or transfusion decisions.
View full size6. From Specification to a Defensible Laboratory Decision
A defensible decision is one another scientist could retrace, from the clinical use through the chosen specification and its evidence to the observed data and the documented outcome. Seven steps make that chain explicit.
- Define the intended use and the decision levels. For example, HGB near 7–8 g/dL for transfusion decisions, or PLT near 10 ×10⁹/L in a defined prophylactic pathway.
- Select the model and the source, and record why. State the rationale, the source and the quality of the evidence [5], and consider what all three models can contribute [1].
- Match the number to the characteristic. A bias limit judges bias, a CV limit judges imprecision, and a TE or MU limit judges only TE or MU. Never compare across characteristics.
- Choose and justify the quality tier. Fraser et al. proposed minimum, desirable and optimum performance goals based on biological variation [20]. Later work applies the same tiers to specifications from the other Milan models [7]. The tiers are not universal regulatory pass/fail thresholds: choose one to suit the intended clinical use, the evidence available and the consequences of error. Where desirable performance cannot yet be achieved, document the limitation, the risk controls and the improvement plan.
- Write the decision rule before seeing the data. Decide whether the rule uses a point estimate or a confidence interval, and which way the burden of proof runs.
- Estimate performance with its uncertainty at the decision levels. A point estimate can support a decision under a predefined point-estimate rule, but it does not show with stated confidence that the true value lies within the limit. Where the rule uses confidence intervals, evaluate them against the criteria set before testing.
- Decide, document and plan. Accept, accept with conditions (for example tighter QC or result review near thresholds), or reject, and set a date for re-evaluation.
When the rule decides: a borderline variant
Keep the Case A assumptions (n = 20, CV 1.5%) but change the estimated bias to +2.5%. The 95% CI becomes 1.78–3.22%, which straddles the +2.0% limit.
| Predefined rule | Question it asks | Answer | Statistical conclusion | Operational action |
|---|---|---|---|---|
| Reject only if the bias is shown to exceed the limit | Does the whole CI lie outside ±2.0% (entirely above +2.0% or entirely below −2.0%)? | No (1.78–3.22% overlaps +2.0%) | Exceedance not demonstrated | May continue in use under the predefined risk policy, with monitoring |
| Accept only if the bias is shown to lie within the limit | Does the whole CI lie within −2.0% to +2.0%? | No (upper limit 3.22%) | Compliance not demonstrated | Not approved yet: collect more evidence or apply other risk controls |
The data are identical, and neither rule has shown that the bias is acceptable or unacceptable. A failure to show exceedance is not evidence of compliance. What differs is the action each rule permits, which is why the rule must be written first and chosen with the clinical risk in mind. For a measurand used near transfusion thresholds, a laboratory may reasonably require evidence of compliance before approval.
Looking ahead to QC11
Measurement uncertainty asks a related question from the side of the individual result. Braga and Panteghini proposed a desirable standard MU specification of 2.80% for blood haemoglobin under Model 1 [9], and Braga et al. proposed 4.85% for platelets under the BV model [10]. Both figures constrain MU, so they cannot be compared with the 2%, 4% and 7% limits in this article. QC11 takes up MU in full.
Key Points
- An APS is a requirement on one performance characteristic; TEa is only one way of writing it.
- Passing IQC shows stability, not that bias is acceptable for patient results.
- The Milan models are three kinds of evidence. Their ranking has been described differently over time, and current EFLM work favours considering all of the evidence.
- For decision use, HGB and PLT belong in Model 1 in principle. Where outcome data are missing, authors have fallen back to different models.
- Limits disagree because they serve different purposes. A PT limit grades one result; it is not a bias specification.
- Write the decision rule before the data arrive, and document the whole chain of evidence.
A performance limit is only meaningful when we can explain where it came from, what it is intended to protect, and why it is appropriate for the result we are evaluating.
References
- Jones GRD, Bell KJL, Ceriotti F, Loh TP, Lord S, Sandberg S, et al. Applying the Milan models to setting analytical performance specifications – considering all the information. Clin Chem Lab Med. 2024;62(8):1531–7. doi:10.1515/cclm-2024-0104
- Sandberg S, Coskun A, Carobene A, Fernandez-Calle P, Diaz-Garzon J, Bartlett WA, et al. Analytical performance specifications based on biological variation data – considerations, strengths and limitations. Clin Chem Lab Med. 2024;62(8):1483–9. doi:10.1515/cclm-2024-0108
- Clinical and Laboratory Standards Institute. Determining allowable total error goals and limits for quantitative medical laboratory measurement procedures. 1st ed. CLSI guideline EP46. CLSI; 2025.
- International Organization for Standardization. ISO 15189:2022 Medical laboratories — Requirements for quality and competence. Geneva: ISO; 2022.
- Sandberg S, Fraser CG, Horvath AR, Jansen R, Jones G, Oosterhuis W, et al. Defining analytical performance specifications: Consensus Statement from the 1st Strategic Conference of the European Federation of Clinical Chemistry and Laboratory Medicine. Clin Chem Lab Med. 2015;53(6):833–5. doi:10.1515/cclm-2015-0067
- Fraser CG. The 1999 Stockholm Consensus Conference on quality specifications in laboratory medicine. Clin Chem Lab Med. 2015;53(6):837–40.
- Ceriotti F, Fernandez-Calle P, Klee GG, Nordin G, Sandberg S, Streichert T, et al. Criteria for assigning laboratory measurands to models for analytical performance specifications defined in the 1st EFLM Strategic Conference. Clin Chem Lab Med. 2017;55(2):189–94. doi:10.1515/cclm-2016-0091
- Zwart A, van Assendelft OW, Bull BS, England JM, Lewis SM, Zijlstra WG; International Council for Standardisation in Haematology: Expert Panel on Haemoglobinometry. Recommendations for reference method for haemoglobinometry in human blood (ICSH standard 1995) and specifications for international haemiglobinocyanide standard (4th edition). J Clin Pathol. 1996;49(4):271–4. doi:10.1136/jcp.49.4.271
- Braga F, Panteghini M. Performance specifications for measurement uncertainty of common biochemical measurands according to Milan models. Clin Chem Lab Med. 2021;59(8):1362–8. doi:10.1515/cclm-2021-0170
- Braga F, Pasqualetti S, Borrillo F, Capoferri A, Chibireva M, Rovegno L, et al. Definition and application of performance specifications for measurement uncertainty of 23 common laboratory tests: linking theory to daily practice. Clin Chem Lab Med. 2023;61(2):213–23. doi:10.1515/cclm-2022-0806
- Horvath AR, Bell KJL, Ceriotti F, Jones GRD, Loh TP, Lord S, et al. Outcome-based analytical performance specifications: current status and future challenges. Clin Chem Lab Med. 2024;62(8):1474–82. doi:10.1515/cclm-2024-0125
- Aarsand AK, Webster C, Fernandez-Calle P, Jonker N, Diaz-Garzon J, Coskun A, et al. The EFLM Biological Variation Database [Internet]. Available from: https://biologicalvariation.eu/ [cited 2026 Nov 7].
- Gras JM, Collin-Chavagnac DA, Scherrer F, Raimbourg JB, Biette C, Vaubourdolle M, et al. An update on state-of-the-art performance for precision in medical laboratories. J Appl Lab Med. 2026;11(6):1512–35. doi:10.1093/jalm/jfag125
- Vis JY, Huisman A. Verification and quality control of routine hematology analyzers. Int J Lab Hematol. 2016;38(Suppl 1):100–9. doi:10.1111/ijlh.12503
- Centers for Medicare & Medicaid Services; Centers for Disease Control and Prevention. Clinical Laboratory Improvement Amendments of 1988 (CLIA) proficiency testing regulations related to analytes and acceptable performance. Final rule (CMS-3355-F). Fed Regist. 2022 Jul 11;87(131).
- Hematology (including routine hematology and coagulation). 42 CFR §493.941(c)(2).
- Centers for Medicare & Medicaid Services. Implementation notification for final rule CMS-3355-F, CLIA proficiency testing – analytes and acceptable performance final rule. Admin Info-23-07-CLIA. 2023 May 3. Available from: cms.gov
- Carson JL, Stanworth SJ, Guyatt G, Valentine S, Dennis J, Bakhtary S, et al. Red blood cell transfusion: 2023 AABB international guidelines. JAMA. 2023;330(19):1892–902. doi:10.1001/jama.2023.12914
- Metcalf RA, Nahirniak S, Guyatt G, Bathla A, White SK, Al-Riyami AZ, et al. Platelet transfusion: 2025 AABB and ICTMG international clinical practice guidelines. JAMA. 2025;334(7):606–17. doi:10.1001/jama.2025.7529
- Fraser CG, Hyltoft Petersen P, Libeer JC, Ricos C. Proposals for setting generally applicable quality goals solely based on biology. Ann Clin Biochem. 1997;34(Pt 1):8–12. doi:10.1177/000456329703400103