1. The CBC Result Looks Precise. But How Certain Is It?
The analyser reports a haemoglobin concentration of 12.3 g/dL. The result has passed the laboratory's quality control checks, and there are no instrument flags requiring further investigation.
But how certain are we that 12.3 g/dL represents the patient's haemoglobin concentration?
A result displayed to one decimal place may appear precise. That decimal place, however, tells us about reporting resolution—not necessarily the uncertainty associated with the measurement.
If the same patient sample were measured repeatedly under different routine operating conditions, the reported values would not be identical every time. Small differences may arise from analytical imprecision, recalibration, reagent changes, or other sources of variation within the measurement process.
Measurement uncertainty (MU) provides a structured way to describe the dispersion of values that could reasonably be attributed to the measurand, given the available information about the measurement procedure.
This does not mean that every result is wrong by a predictable amount. Nor does MU represent the maximum possible error.
MU describes uncertainty associated with a measurement result, not an observed error in that result.
The distinction matters because the laboratory rarely knows the true value of a patient's sample. What it can assess is the performance of its measurement process and the uncertainty associated with results produced by that process.
Earlier articles in this series explored precision, bias, method comparison, and analytical performance specifications (APS). The previous article asked how much analytical error is acceptable.
Here, the question becomes more practical:
Can we estimate the uncertainty of our routine CBC results, and is that uncertainty sufficiently small for their intended clinical use?
The answer begins with data that most laboratories already collect every day: internal quality control (IQC).
2. Where Does Measurement Uncertainty Come From?
Uncertainty does not originate from a single component.
A modern haematology analyser operates through a measurement system involving reagents, calibration, instrument conditions, and the examination procedure itself. Each may contribute to variability or uncertainty in the final result.
For practical purposes, two broad contributions are particularly important.
Within-laboratory imprecision
Within-laboratory imprecision describes variation observed when a measurement procedure operates under routine conditions over time.
Unlike short-term repeatability, it should encompass relevant day-to-day influences, including routine recalibration, maintenance, reagent changes, and normal operating conditions.
These effects may contribute to within-laboratory standard uncertainty, commonly represented as uRw.
The distinction between repeatability and intermediate precision is important.
Ten consecutive measurements performed on one analyser during a single session may demonstrate excellent repeatability. They cannot establish how that analyser performs across several months of routine operation.
A short-term CV may therefore underestimate the variability experienced by patient results.
Calibration and metrological traceability
Another important contribution concerns the uncertainty associated with the calibration hierarchy.
Metrological traceability relates a measurement result to an appropriate reference through a documented chain of calibrations and value assignments. Each relevant step may contribute uncertainty.
The uncertainty associated with the assigned value of an end-user calibrator, including contributions inherited from preceding steps, may be represented as uCal.
This information is not always readily available to clinical laboratories.
However, the absence of a documented value does not establish that calibration uncertainty is zero.
What about double-counting?
Not every source should automatically be inserted into the uncertainty budget as a separate term.
For example, routine recalibration effects may already be partly represented in sufficiently comprehensive long-term IQC data. Adding the same contribution again would double-count uncertainty.
There is an important haematology-specific limitation, however.
Haematology analysers may require relatively infrequent calibration. Even one or two years of IQC data may contain only a small number of calibration events.
Consequently, long-term IQC cannot automatically be assumed to capture the full variability associated with calibration.
The laboratory needs to distinguish variability arising from routine recalibration events from uncertainty inherited through the calibration hierarchy. The latter may remain relevant even when the analyser has not been recalibrated for a considerable period.
Conversely, removing a systematic shift during IQC data processing does not make the underlying patient-related uncertainty disappear.
A defensible uncertainty budget must therefore answer two questions:
- Which sources are already represented by the available performance data?
- Which relevant contributions remain outside those data and require separate evaluation?
This becomes particularly important in haematology because routine IQC data commonly span several control-material lots.
3. Estimating MU from Long-Term IQC: The Lot-Pooling Problem
A top-down approach uses observed performance data from the routine measurement process to estimate uncertainty.
For many laboratories, long-term IQC provides the most accessible starting point.
However, collecting more QC results does not automatically produce a better uncertainty estimate. The way those results are grouped and analysed matters.
Why simply combining all IQC results can be misleading
Haematology control materials have limited usable lifetimes. Over a sufficiently long observation period, the laboratory will inevitably use several IQC lots.
Each lot may have a different target mean, even when the same parameter and nominal control level are being monitored.
At the same time, the laboratory may introduce new reagent lots.
These changes create an important analytical problem: a shift in IQC results does not necessarily mean that patient results have shifted by the same amount.
Consider three simulated groups of HGB IQC observations from one analyser.
| Group | IQC lot | Reagent lot | n | Mean HGB (g/dL) | SD (g/dL) | CV |
|---|---|---|---|---|---|---|
| 1 | A | R1 | 20 | 11.8 | 0.1000 | 0.847% |
| 2 | A | R2 | 20 | 11.9 | 0.1042 | 0.876% |
| 3 | B | R2 | 20 | 12.2 | 0.1100 | 0.902% |
All values are simulated for educational purposes. The grouping is deliberately constructed to distinguish the two lot transitions.
Group 1 → Group 2: Reagent lot change
The IQC material remains Lot A, while the reagent changes from R1 to R2.
The mean increases from 11.8 to 11.9 g/dL.
Because the control material has not changed, a reagent-associated effect becomes a reasonable possibility.
But an IQC mean shift alone does not establish that patient results have changed. The effect may reflect a reagent–control material interaction rather than a comparable shift in fresh patient samples.
Appropriate lot-to-lot verification is required.
This is the distinction explored in Lot-to-Lot Verification in Haematology: Did the New Reagent Lot Change Patient Results?.
Group 2 → Group 3: IQC material lot change
The reagent remains R2, while the IQC material changes from Lot A to Lot B.
The mean increases from 11.9 to 12.2 g/dL.
This transition raises the possibility of a control-material-associated difference.
If the shift reflects only the different assigned values or matrix characteristics of the IQC materials, it should not automatically be treated as a shift in patient measurements.
However, the unchanged reagent lot does not prove that the entire difference comes from the control material.
Calendar-related changes, instrument behaviour, or other concurrent influences may still contribute. Overlapping control-lot measurements, patient-based comparisons, or other independent evidence may be needed to establish the cause.
The three groups therefore help identify which transition deserves investigation. They do not establish causality by themselves.
Why the combined CV can become misleading
If all 60 observations are combined into one dataset without accounting for the three group means, the overall CV is approximately:
Raw combined CV = 1.671%
This includes both within-group variation and differences between group means.
But not every difference between IQC group means necessarily represents variation in patient results.
Miller [1] describes partitioning IQC observations according to combinations of IQC material lot and reagent lot, then pooling their SDs or CVs.
For comparable control concentration levels, the pooled CV can be calculated as:
CVpooled = √[Σ((ni − 1) × CVi²) / Σ(ni − 1)]
Where:
- CVi is the CV within group i.
- ni is the number of observations in group i.
- Each group represents an appropriate IQC lot × reagent lot combination.
For the simulated data:
CVpooled = 0.875%
| Calculation method | Estimated CV |
|---|---|
| Direct combination of all observations | 1.671% |
| Pooled within-group CV | 0.875% |
The pooled estimate avoids automatically treating all differences between QC group means as within-laboratory imprecision.
But that improvement creates another methodological responsibility.
What happens to the variation removed by partitioning?
Partitioning is not a method for making unwanted variation disappear.
Suppose a new reagent lot introduces a genuine shift in patient results.
If each reagent-lot group is centred around its own mean, the difference between those means will no longer contribute to the pooled within-group CV.
The calculation may look better, while the patient measurement process has not improved.
This is why the following principle is essential:
Every source of variation removed by partitioning must be demonstrated to be irrelevant to patient results, corrected with residual uncertainty considered, or accounted for elsewhere in the uncertainty budget.
A control-material-associated difference that does not affect patient specimens need not be represented as patient-result variation.
A genuine reagent-related patient-result shift is different. It requires investigation, correction where appropriate, and evaluation of any residual uncertainty.
Evidence of systematic bias may come from appropriate external quality assessment (EQA), reference-based comparisons, patient-sample method comparisons, or other validated procedures.
The interpretation depends on the evidence. A single EQA result or IQC mean shift does not independently establish a reliable estimate of bias.
For further discussion, see External Quality Assessment in Haematology: When a Passing Score Is Not Enough and Method Comparison in Haematology: Why Correlation Is Not Enough.
What should—and should not—be partitioned?
For routine top-down estimation, appropriate analytical strata may be based on IQC lot, reagent lot, analyser, and QC concentration level.
These distinctions identify relevant measurement conditions. They do not automatically justify ignoring differences between those conditions.
By contrast, routine calibration events, scheduled maintenance, operator changes, and dates should not be used as additional centring categories merely to reduce the estimated CV.
Their normal effects are part of the operating variability that uRw is intended to represent.
This does not mean invalid QC observations must be retained. Documented analytical failures, out-of-control episodes, or non-routine events require investigation and appropriate treatment according to laboratory policy.
But excluding a genuine routine change simply because it increased variability would produce an artificially favourable uncertainty estimate.
How long should the IQC period be?
There is no universal observation period suitable for every measurement procedure.
Miller [1] explains why short observation periods can underestimate variability and suggests that examining approximately two years or more of Levey–Jennings data may help identify important changes over time.
Where historical data are available, reviewing around two years of IQC trends is therefore useful.
The estimation period itself should be selected according to the measurement process and should adequately represent common reagent-lot changes, routine calibration, maintenance, and other relevant conditions.
The objective is not to satisfy an arbitrary number of months.
It is to capture the variation relevant to future patient results.
Haematology has another complication: control-material ageing
Stabilised cellular control materials may change during their usable lifetime.
Kim, Lee, Song, and Song [4] examined MCV behaviour in commercial haematology control materials used on ADVIA 2120i, Sysmex XE-2100, and Beckman Coulter DxH 800 systems.
They found that MCV increased over time in all investigated control materials. By the fifth week, most showed deviations greater than one SD, with some exceeding four SD.
This observation is particularly relevant to haematology.
An increasing MCV in a control material does not necessarily mean that patient MCV measurements are drifting by the same amount.
Control-material ageing may inflate the SD within an IQC lot. Conversely, automatically adjusting the target mean to remove the trend may conceal genuine analytical changes.
The laboratory must investigate control stability, storage conditions, lot age, and independent evidence from patient measurements before deciding how to interpret the trend.
MCV and related indices deserve particular attention because their apparent IQC variability may be influenced by material-specific behaviour.
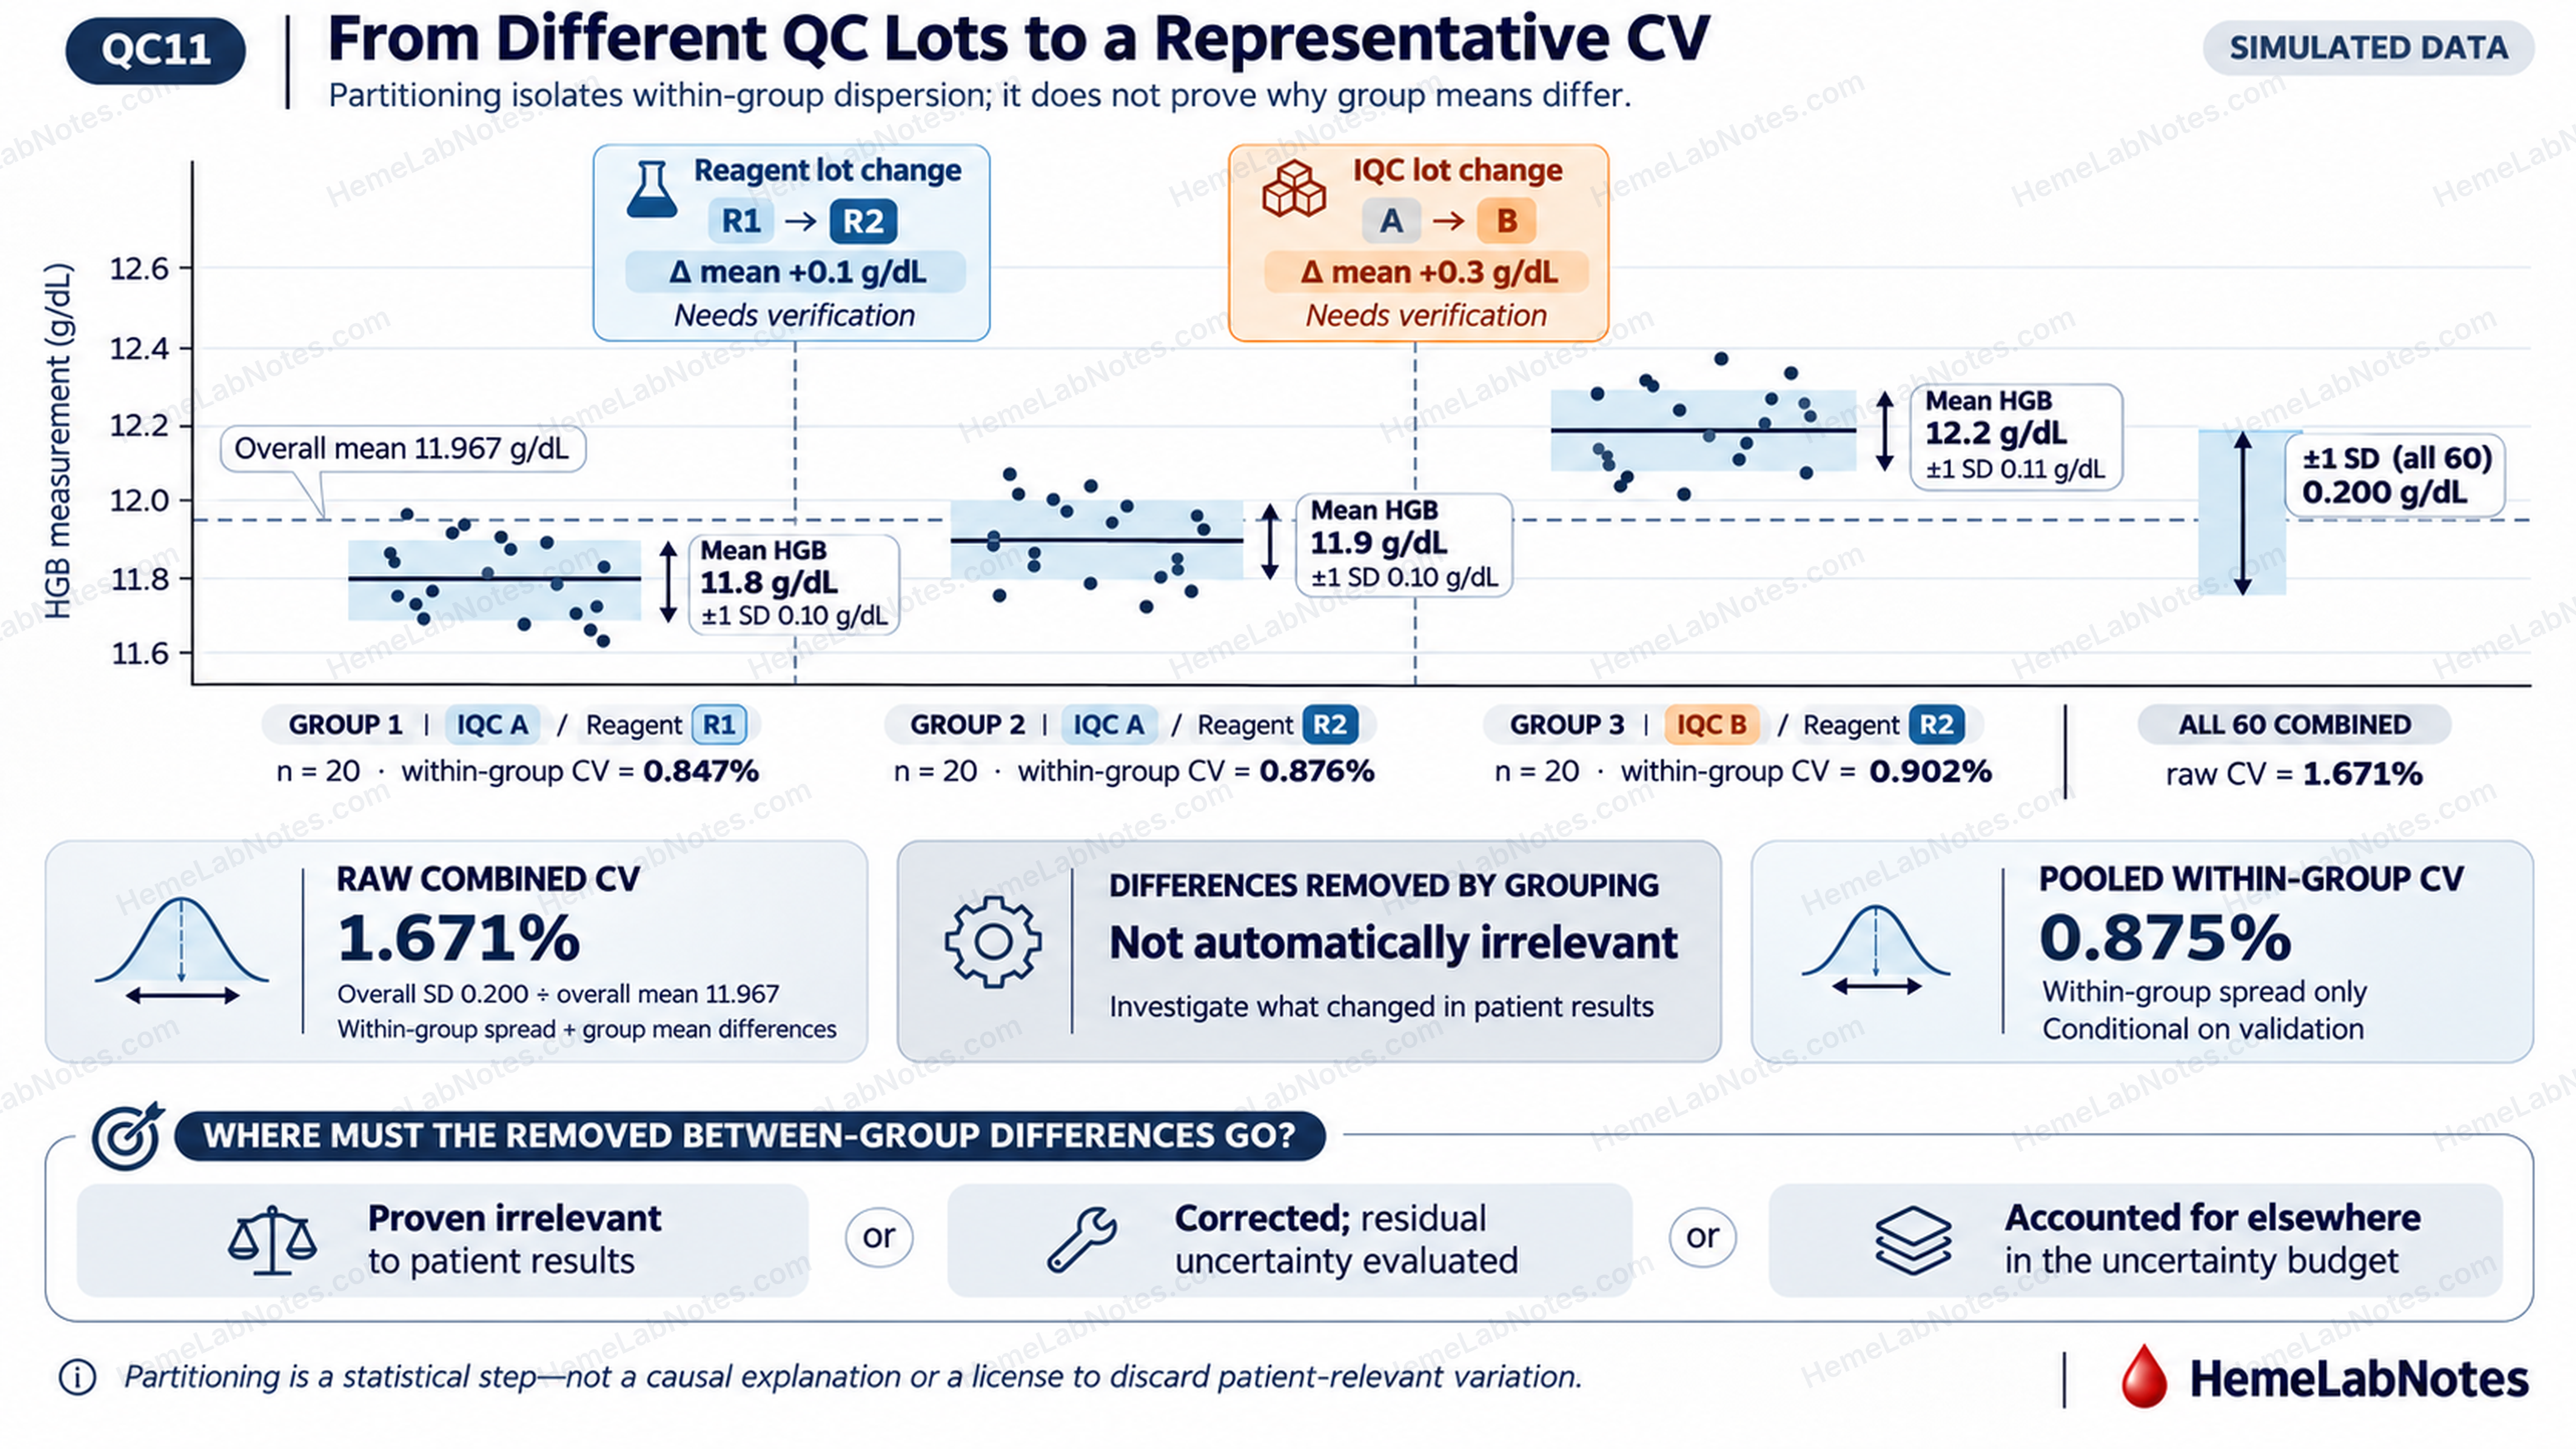
Figure 1. Effect of IQC and reagent lot changes on the estimation of within-laboratory imprecision. Sixty simulated HGB measurements are divided into three IQC–reagent lot combinations. Direct pooling produces a CV of 1.671%, whereas pooling the within-group CVs gives 0.875%. Differences between group means must be investigated and either demonstrated to be irrelevant to patient results, corrected with residual uncertainty considered, or accounted for elsewhere in the uncertainty budget.
View full size4. Worked Example: From Pooled CV to Expanded Uncertainty
We can now continue the same HGB example without introducing an unrelated precision estimate.
From Section 3:
Pooled HGB CV = 0.875%
For the baseline scenario, assume that appropriate patient-sample lot-to-lot verification found no clinically relevant HGB shift between reagent lots R1 and R2. Also assume that the IQC-lot mean difference was assessed and was not associated with a corresponding change in patient results.
These are explicit assumptions for the simulated example, not conclusions established by the IQC observations alone.
With the removed mean differences addressed on that basis, assume the pooled CV has been evaluated and found suitable for patient results around 12.0 g/dL.
Step 1 — Calculate uRw
At a reference concentration of 12.0 g/dL:
uRw = 12.0 × (0.875 / 100)
uRw = 0.105 g/dL
This represents the estimated within-laboratory standard uncertainty for the stated measurement scope.
It does not necessarily include every relevant uncertainty contribution.
Step 2 — Obtain calibration uncertainty
Ideally, calibration uncertainty should be obtained from the manufacturer or an appropriate validated source.
The laboratory should establish whether the supplied quantity is standard uncertainty or expanded uncertainty, identify its coverage factor, and determine which contributions are already included.
Rigo-Bonnin and colleagues [10] describe how manufacturers commonly provide the assigned calibrator value together with an expanded uncertainty using a coverage factor of k = 2.
If an expanded calibration uncertainty is supplied:
uCal = UCal / k
For this educational calculation, assume that a standard calibration uncertainty of 0.080 g/dL has been established.
This value is hypothetical. It is not a manufacturer specification for any particular haematology analyser.
We also assume that uRw and uCal represent independent contributions and that the same uncertainty component has not already been included in both terms.
Step 3 — Calculate combined standard uncertainty
Under these assumptions:
uc = √(uRw² + uCal²)
Substituting:
uc = √(0.105² + 0.080²)
uc = 0.132 g/dL
In a real uncertainty budget, additional relevant components, correlations, and uncertainty associated with bias correction must be considered.
Step 4 — Calculate expanded uncertainty
Expanded uncertainty is obtained by multiplying combined standard uncertainty by a coverage factor.
Using k = 2:
U = 2 × 0.132 = 0.264 g/dL
The corresponding relative expanded uncertainty is:
U% = (0.264 / 12.0) × 100 = 2.20%
For a patient with a reported HGB of 12.3 g/dL, an illustrative expression would be:
HGB = 12.3 ± 0.3 g/dL (k = 2)
The expanded uncertainty is rounded to the reporting resolution for this example. The underlying calculation and subsequent APS comparison retain the unrounded value.
This interval is intended to describe uncertainty associated with an individual patient result near the validated concentration—not uncertainty in the mean of the IQC measurements.
A coverage factor of approximately 2 is commonly associated with roughly 95% coverage under suitable statistical assumptions. It is not an unconditional guarantee that every possible error falls within that interval.
Routine CBC reports do not generally need to display expanded MU beside each result. The laboratory should nevertheless understand and be able to communicate its uncertainty estimates when appropriate.
What if the reagent-lot shift affects patient results?
The baseline calculation assumes that the 0.1 g/dL difference between Groups 1 and 2 does not represent a clinically relevant patient-result shift.
Now consider the opposite scenario.
Suppose independent patient-sample verification demonstrates that the reagent change produces a genuine 0.1 g/dL HGB shift.
The appropriate first response would be to investigate and, where indicated, correct or harmonise the measurement process.
If the shift remains relevant to the defined measurement process, it cannot simply disappear from the uncertainty assessment because the IQC data were partitioned.
For an illustrative sensitivity calculation, consider the two matched-control reagent-lot means:
- R1: 11.8 g/dL
- R2: 11.9 g/dL
The sample SD of these two means is approximately 0.071 g/dL.
Treating this as a hypothetical additional standard uncertainty component, and assuming it is independent of the other contributions:
uc = √(0.105² + 0.080² + 0.071²)
uc ≈ 0.150 g/dL
U ≈ 0.300 g/dL
U% ≈ 2.50%
This increases expanded uncertainty from 2.20% to approximately 2.50%.
Under the selected 2.70% MAU, the numerical result would still pass, but with considerably less margin.
This is a sensitivity illustration, not a validated estimator of between-reagent-lot uncertainty. With only two lot means, the SD is highly unstable. Its suitability also depends on actual lot usage, patient-sample evidence, correction status, and whether related variation is already represented elsewhere.
For example, an equally weighted mixture of two fixed means separated by 0.1 g/dL has a population between-lot SD of 0.050 g/dL, rather than the two-point sample SD of 0.071 g/dL.
A defensible laboratory estimate requires a model matched to the intended measurement process and sufficient independent evidence.
The purpose of the example is to demonstrate the core rule from Section 3:
A patient-relevant source of variation removed by partitioning must be corrected, shown to be irrelevant, or accounted for elsewhere—not silently discarded.
What if calibration uncertainty is larger?
The conclusion also depends on the assumed uCal.
Returning to the baseline scenario and keeping uRw fixed at 0.105 g/dL:
| uCal (g/dL) | Expanded U (g/dL) | U% |
|---|---|---|
| 0.080 | 0.264 | 2.20% |
| 0.120 | 0.319 | 2.66% |
| 0.130 | 0.334 | 2.79% |
A comparatively small increase in calibration uncertainty can materially alter the estimated expanded MU.
This concern cannot be resolved by simply ignoring unavailable calibration information.
When uCal cannot be obtained, the laboratory should seek clarification from the manufacturer, examine any suitable alternative evidence, and document which contributions remain unquantified.
A precision-based estimate may still be useful as a limited performance indicator.
However, it should not automatically be presented as a complete estimate of uncertainty for patient results.
Missing calibration information is not evidence of zero calibration uncertainty.
Rigo-Bonnin et al. [10] support the interpretation and conversion of manufacturer-provided calibration uncertainty. Their article should not be interpreted as providing a validated substitute for an unavailable commercial calibrator uncertainty value.
How certain is the estimated CV itself?
The pooled CV is also an estimate derived from a finite number of observations.
In the three-group example, there are 60 observations distributed across three groups, giving:
Degrees of freedom = 60 − 3 = 57
Under the simplifying assumptions of independent observations, approximately normal within-group measurement distributions, and a suitable common relative-variance model, a chi-square-based confidence interval can be estimated for the pooled CV.
For the simulated data:
Pooled CV = 0.875%
Approximate 95% CI = 0.74% to 1.07%
This interval describes sampling uncertainty in the estimated analytical CV. It is not the expanded measurement uncertainty of a patient result.
A laboratory with relatively few observations may obtain a favourable pooled CV simply because the available dataset does not adequately represent longer-term performance.
Increasing the number of observations can improve statistical precision, but it cannot compensate for missing reagent changes, calibration events, or other relevant sources of variability.
A precisely calculated CV from an unrepresentative dataset is not necessarily a reliable estimate of routine performance.
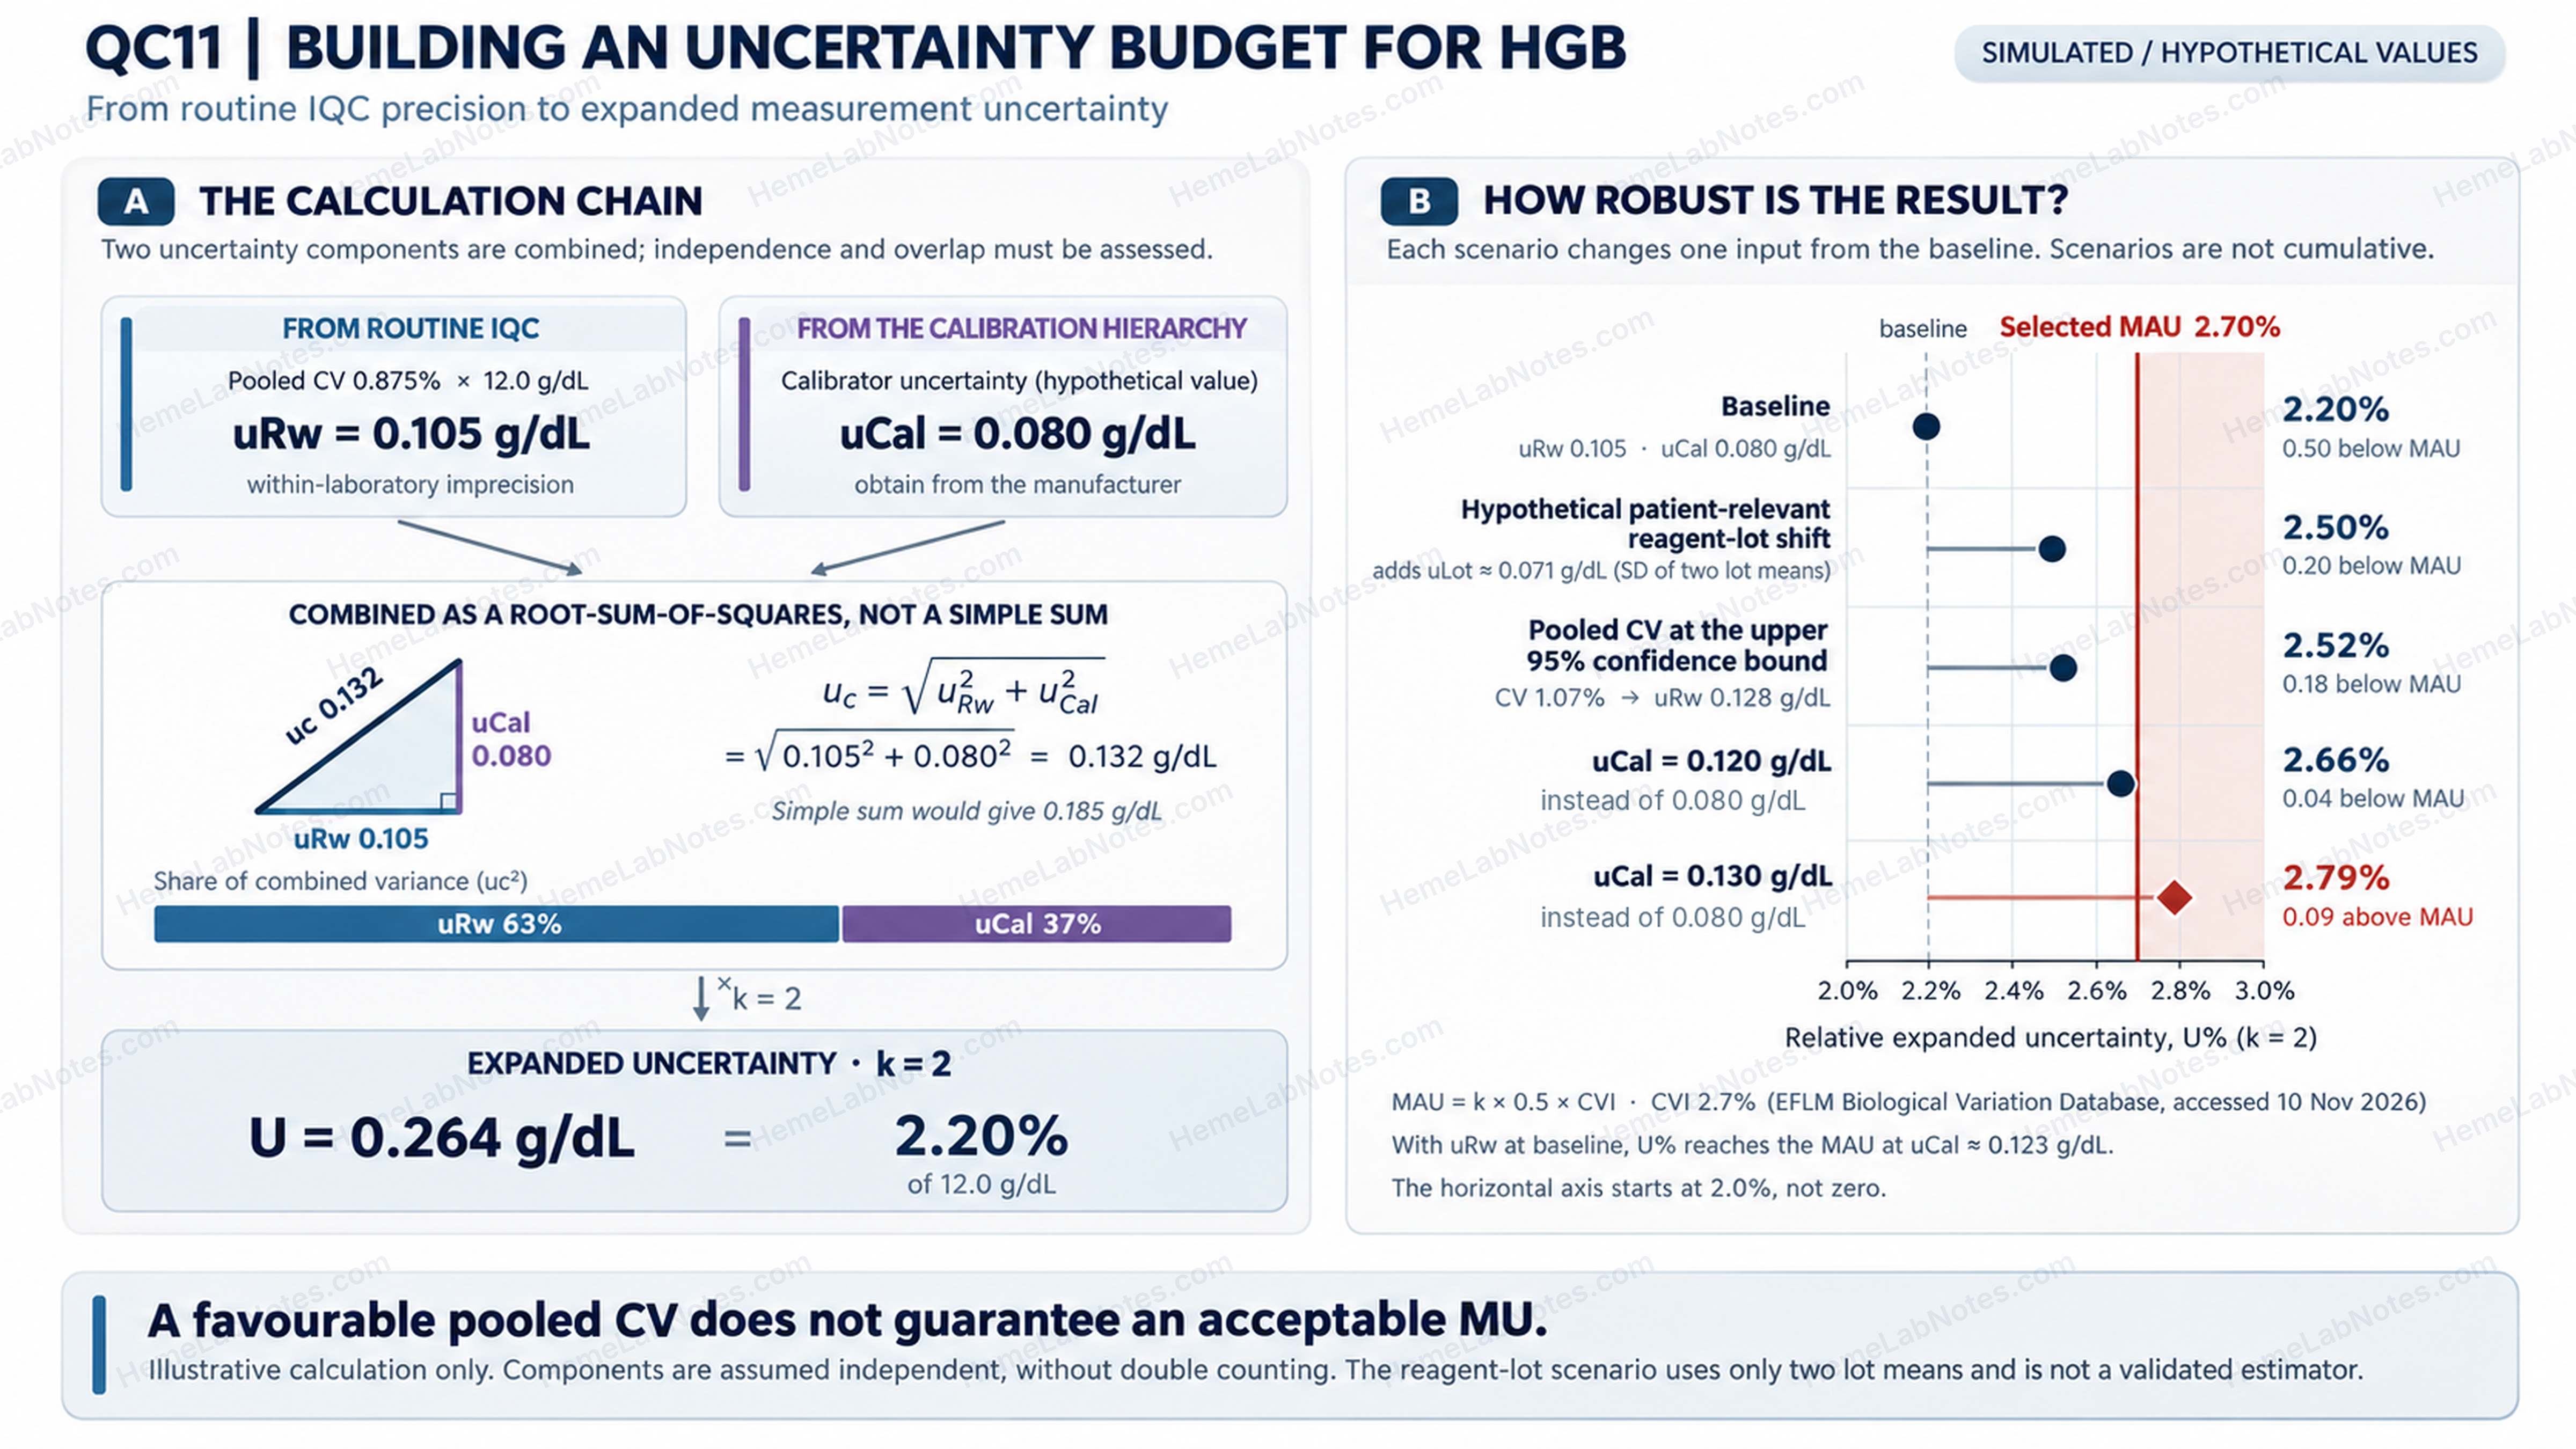
Figure 2. Estimating expanded measurement uncertainty from simulated HGB IQC data. A pooled CV of 0.875% gives a within-laboratory standard uncertainty of 0.105 g/dL at 12.0 g/dL. Combining this with a hypothetical calibration uncertainty of 0.080 g/dL yields an expanded uncertainty of 0.264 g/dL (2.20%, k = 2). Five sensitivity scenarios illustrate how uncertainty components and estimation uncertainty affect comparison with a selected MAU of 2.70%.
View full size5. Is the Uncertainty Acceptable? MU versus MAU
Estimating uncertainty is only the beginning.
The next question is whether that uncertainty is acceptable for the intended clinical application.
This requires an appropriate analytical performance specification.
Why MU should not be compared directly with TEa
Total allowable error (TEa) and measurement uncertainty belong to different analytical frameworks.
TEa combines concepts of analytical imprecision and bias within a total-error model.
Measurement uncertainty instead describes uncertainty associated with a measurement result using relevant components and their relationships.
Although both may be expressed as percentages, an expanded uncertainty of 2.2% cannot be assessed simply by comparing it with an unrelated TEa of 2.2%.
The comparison must use a specification designed for the uncertainty model being applied.
Sandberg and colleagues [2] discuss the strengths, limitations, and intended applications of biological-variation-based specifications for imprecision, bias, total error, and allowable measurement uncertainty.
Standard and expanded maximum allowable uncertainty
In the desirable biological-variation model discussed by Sandberg et al.:
MAu = 0.5 × CVI
Where MAu is maximum allowable standard measurement uncertainty and CVI is within-subject biological variation.
For expanded uncertainty:
MAU = k × 0.5 × CVI
When k = 2:
MAU = CVI
The factor 0.5 originates from the desirable analytical imprecision specification based on biological variation.
Applying it to a broader uncertainty budget therefore requires an explicit choice of APS model and a clear definition of which uncertainty components are being assessed.
A specification for imprecision alone must not be confused with a specification for combined uncertainty.
These expressions are not universal acceptance criteria for every measurand or clinical application.
Applying the EFLM HGB specification
The EFLM Biological Variation Database [6] lists a whole-blood haemoglobin meta-analysis estimate of:
CVI = 2.7%
Database accessed: 10 November 2026. The database is updated as biological-variation evidence is reviewed.
Using the desirable specification:
Allowable imprecision = 0.5 × 2.7% = 1.35%
For expanded MU with k = 2:
MAU = 2 × 0.5 × 2.7% = 2.70%
Our worked example provides:
| Parameter | Estimated | Specification |
|---|---|---|
| Pooled analytical CV | 0.875% | 1.35% |
| Expanded MU | 2.20% | 2.70% |
The analytical imprecision estimate is below the desirable imprecision specification.
The expanded MU is also below the corresponding expanded MAU.
However, this is a conditional pass.
The example assumes that the selected IQC data represent patient-result performance, the calibration contribution is valid, relevant mean shifts have been appropriately addressed, and the uncertainty budget contains no important unaccounted components.
How much confidence should we place in that pass?
The calibration sensitivity analysis provides one perspective.
At uCal = 0.120 g/dL, U increases to approximately 2.66%, leaving little margin below the selected MAU.
At uCal = 0.130 g/dL, U reaches approximately 2.79% and exceeds the 2.70% specification.
The approximate boundary for this model occurs at:
uCal = 0.123 g/dL
But calibration uncertainty is not the only uncertain input.
Recall that the pooled CV of 0.875% has an approximate 95% confidence interval of 0.74%–1.07%.
If we use the upper confidence limit as a sensitivity scenario:
uRw = 12.0 × (1.07 / 100) = 0.1284 g/dL ≈ 0.128 g/dL
Keeping uCal at 0.080 g/dL:
U = 2 × √(0.1284² + 0.080²)
U ≈ 0.303 g/dL
U% ≈ 2.52%
The estimated MU remains below 2.70%, but the margin is much smaller.
The upper confidence limit is not itself a formal MU acceptance rule. It illustrates how sampling uncertainty in the estimated CV can affect the conclusion.
The result also remains conditional on the completeness of the uncertainty budget.
These sensitivity analyses make the same practical point from different directions:
A favourable MU estimate is only as reliable as the data, assumptions, and uncertainty components used to produce it.
Why some CBC indices struggle with stringent specifications
Oosterhuis and colleagues [3] evaluated measurement uncertainty for routine haematology parameters across seven laboratories and eleven measurement systems.
The study reported that most evaluated results fulfilled the selected biological-variation-based specifications and illustrated how correction procedures could improve results outside specification.
This supports the practical use of MU estimates in evaluating analytical performance.
However, the study's relatively short observation period and single control-material lot should not be interpreted as validation of long-term, multi-lot MU estimation.
Some CBC indices may also face particularly stringent biological-variation-based specifications because their within-subject biological variation is small.
A failure to meet such a specification does not necessarily imply unusually poor analytical precision. The permitted uncertainty itself may be demanding.
Control-material instability is another possible contributor to apparent IQC variation, particularly for MCV. Its relevance must be established in the local measurement system.
There is also a methodological distinction.
When suitable IQC data are available for MCV, MCH, or MCHC, a top-down estimate can be obtained directly from the performance data for each reported parameter.
Mathematical propagation from component measurements is not automatically required.
Propagation becomes relevant when building a bottom-up model from input quantities. Such calculations must consider correlations between those inputs where applicable.
Furthermore, what is directly measured and what is calculated depends on the instrument platform.
Sysmex's white paper describes how its haematology analysers determine HCT from the cumulative number and heights of RBC pulses, rather than relying solely on an RBC × MCV calculation [11].
The Sysmex XN-L Series General Information manual explicitly gives MCV as a calculated parameter:
MCV (fL) = 10 × HCT (%) / RBC (×10⁶/µL) [12]
This manufacturer-specific example illustrates why the derivation of CBC parameters should not be assumed identical across all analytical platforms.
The uncertainty model must reflect the actual measurement procedure.
6. One Test, Multiple Analysers: Whose MU Are We Estimating?
A laboratory may have two haematology analysers performing the same CBC examinations.
Both produce results under acceptable QC conditions. Both are used interchangeably for routine patient samples.
Does each analyser require a separate MU estimate?
Or should the laboratory report one uncertainty estimate covering the combined process?
The answer depends on how patient results are generated and the intended scope of the estimate.
System-specific uncertainty
If the laboratory wants to characterise one analyser, its long-term performance data should be evaluated for that analyser.
Pooling its results indiscriminately with data from another analyser would obscure differences between the systems.
Combined measurement-process uncertainty
If patient samples can be assigned to either analyser and the results are intended to be interchangeable, the combined process may need to account for both within-analyser variation and residual differences between analysers.
A simplified weighted variance model is:
u²mix = Σ(wj × u²Rw,j) + Σ[wj × (x̄j − x̄w)²]
Where:
- wj is the proportion of examinations assigned to analyser j.
- uRw,j is the relevant within-analyser standard uncertainty.
- x̄j is the mean result for analyser j.
- x̄w is the weighted mean across analysers.
- The weights sum to 1.
The first term represents pooled within-analyser variance.
The second represents between-analyser variation attributable to differences in their mean results.
This is a mixture-variance model. It is appropriate only when its assumptions match the actual laboratory testing arrangement.
Three conditions before using the formula
First: use comparable material and measurement conditions.
Inter-analyser mean differences should be evaluated using the same IQC lot, the same reagent lot where applicable, and the same observation period.
Otherwise, apparent analyser differences may reflect material or reagent-lot changes rather than instrument-specific performance.
Where QC materials are noncommutable, patient-sample comparisons may be necessary to establish whether observed differences genuinely affect patient results.
Second: address significant systematic differences before pooling.
A substantial analyser bias should not simply be absorbed into a larger uncertainty estimate.
The laboratory should investigate the difference, harmonise the systems where appropriate, and evaluate residual variation after correction.
Oosterhuis et al. [3] illustrated the value of identifying differences between measurement systems and using correction procedures to improve analytical performance.
Third: avoid double-counting shared uncertainty contributions.
If two analysers share a calibration hierarchy or calibrator lot, a common calibration uncertainty contribution should be represented once in the overall uncertainty budget, with the appropriate treatment of correlations.
Observed inter-analyser mean differences may already contain calibration-related residual variation.
The laboratory must distinguish shared uncertainty contributions from system-specific components to avoid counting the same effect twice.
The displayed formula addresses within-analyser variability and residual between-analyser differences. A common calibration uncertainty that is not already represented must be handled separately.
Why two analysers require particular caution
When there are only two analysers, the between-analyser component is informed by a single contrast between their mean results.
This provides limited evidence about the stability of system differences over time.
A single IQC comparison should therefore not be the primary basis for claiming interchangeability.
Appropriately designed patient-sample method comparison provides stronger evidence, especially when it evaluates clinically relevant concentrations and uses suitable acceptance criteria.
See Method Comparison in Haematology: Why Correlation Is Not Enough.
Does sample allocation matter?
Yes.
The weighted mixture model treats analyser assignment as part of the measurement process.
It is most directly applicable when patient specimens are distributed between analysers in a way reasonably represented by the chosen weights.
If patient specimens are not assigned randomly—for example, if one analyser handles a particular clinical unit or sample category—the mixture may not adequately represent individual patient results.
Serial monitoring creates an additional concern.
If a patient's previous CBC was measured on Analyser A and the next sample on Analyser B, a residual between-analyser bias may directly affect the apparent change.
That effect should not automatically be treated as random noise in the interpretation of serial results.
For such applications, inter-analyser agreement and the actual measurement pathway may matter more than a single pooled uncertainty percentage.
The practical question is:
Are we estimating uncertainty for one analyser, or uncertainty for the process through which the laboratory produces interchangeable patient results?
Those are related but not identical quantities.
7. When Uncertainty Matters at the Bench
The clinical relevance of measurement uncertainty becomes clearer when a result approaches a decision threshold.
Platelet counting provides an especially important example.
A platelet count of 18 × 10⁹/L
Consider a simulated patient whose automated platelet count is 18 × 10⁹/L.
A clinical team may be assessing the result in the context of bleeding risk, treatment, or an invasive procedure.
The laboratory has an established platelet CV from its routine low-level IQC.
Can that CV be used to calculate MU at 18 × 10⁹/L?
Not necessarily.
The problem of concentration-dependent imprecision
Analytical imprecision is not always constant across a measurement range.
At very low platelet concentrations, fewer cells are counted within the measurement volume. Under a simple counting-statistics model, relative random variation increases approximately as the inverse square root of the number of counted events.
In other words, when fewer cells are counted, random counting variation becomes proportionally larger.
Real haematology measurement systems involve additional analytical factors, but this principle helps explain why the CV may increase as platelet concentration falls.
A low-level commercial platelet control may still have a concentration substantially higher than 10–20 × 10⁹/L.
Its CV therefore cannot automatically represent analytical performance at a severe thrombocytopenic concentration.
Schoorl and colleagues [5] investigated low platelet counting using a Sysmex XN2000.
Their study included 37 patient samples with platelet counts below 50 × 10⁹/L.
For the precision experiment, samples at four concentration levels underwent ten consecutive measurements.
At approximately 20 × 10⁹/L, the authors reported reproducibility CVs of:
| Method | CV |
|---|---|
| PLT-I | 9.3% |
| PLT-O | 8.5% |
| PLT-F | 3.0% |
The study uses the term reproducibility. However, the ten consecutive measurements describe short-term repeated measurement conditions rather than months of routine intermediate precision.
These values must not be substituted directly for a laboratory's long-term uRw or expanded MU.
They do, however, illustrate an important principle: platelet counting methods can exhibit substantially different precision at low concentrations.
The laboratory should establish appropriate performance information near the concentrations relevant to its intended clinical decisions.
Where routine IQC levels do not cover that range, supplementary low-count patient-sample studies or other suitable performance evidence may be necessary.
Does an uncertainty interval decide whether a patient needs platelets?
No.
An uncertainty estimate helps explain analytical confidence in the measured result. It does not independently determine the appropriate transfusion threshold or clinical intervention.
Clinical decisions must consider the patient's condition, bleeding, treatment, procedural requirements, relevant guidelines, and other available information.
For a suspicious or unexpected platelet result, the laboratory must also consider measurement interference and sample-related problems.
Platelet clumping, abnormal cell populations, and instrument flags may require additional investigation.
Such problems are not adequately addressed merely by expanding an MU interval calculated from routine IQC.
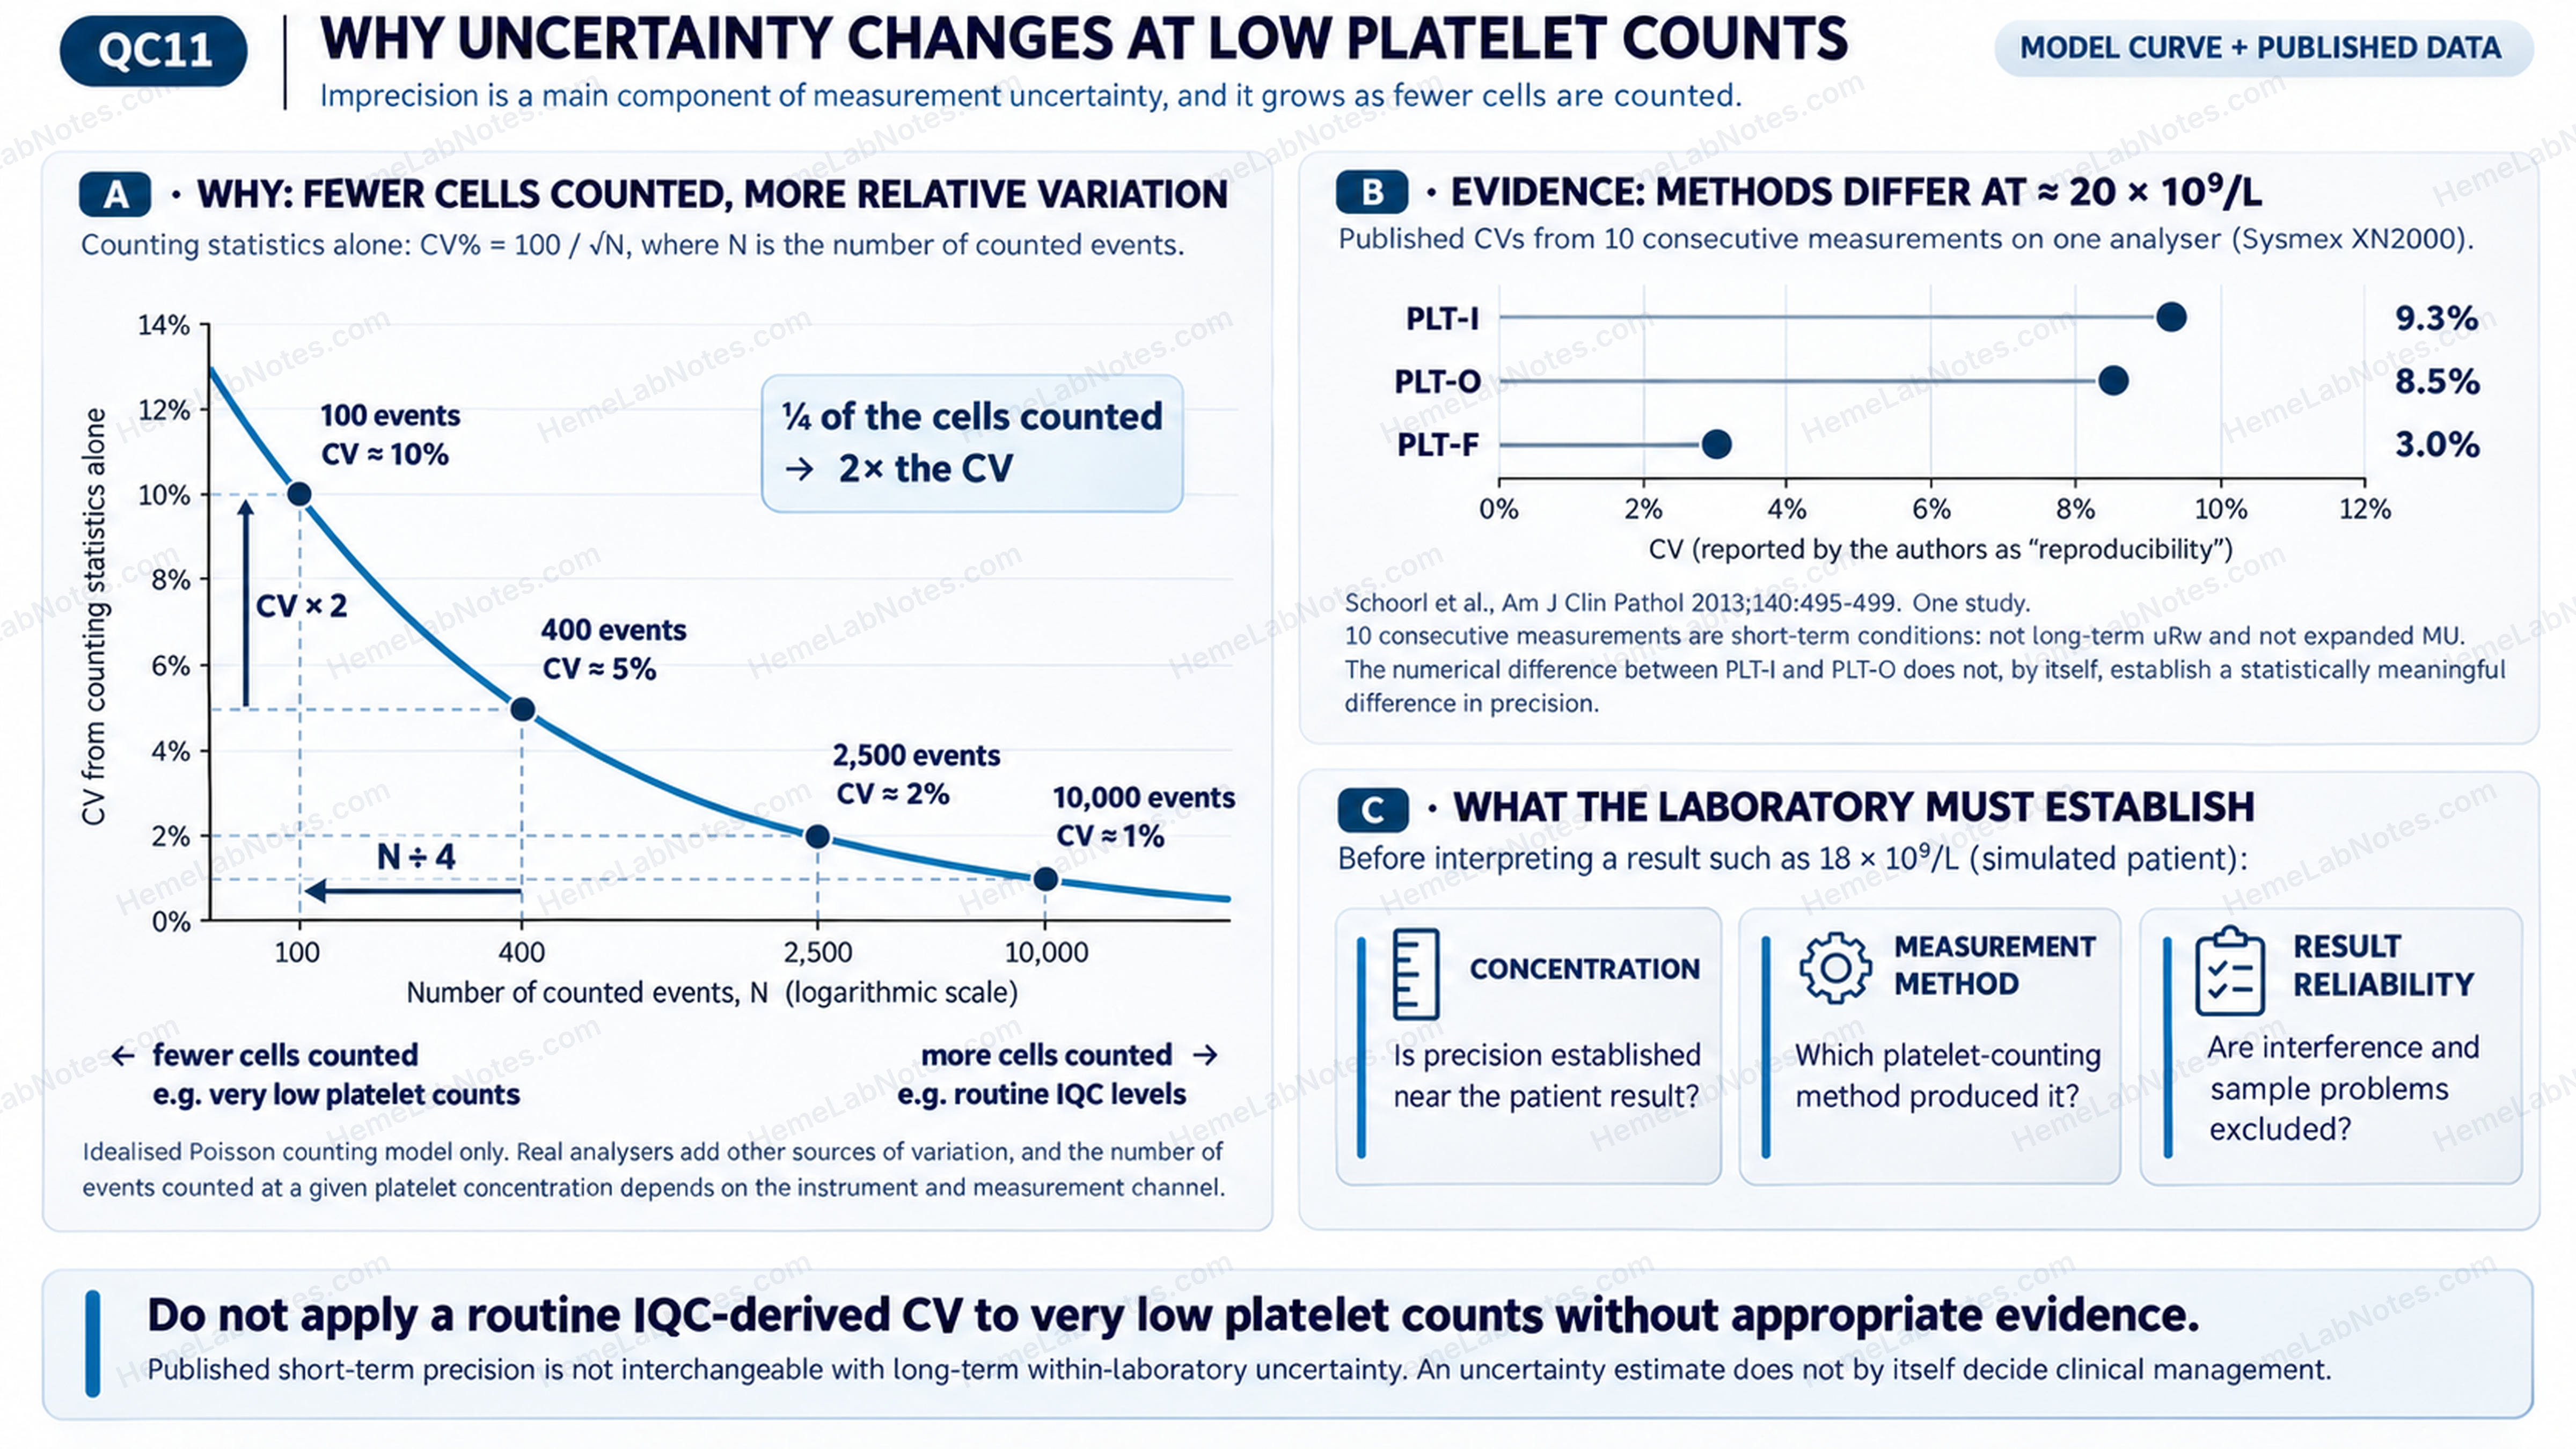
Figure 3. Concentration-dependent imprecision in platelet counting. (A) An idealised Poisson counting model demonstrates increasing relative variation as fewer events are counted, without assigning event counts to specific platelet concentrations. (B) Published short-term reproducibility CVs at approximately 20 × 10⁹/L illustrate differences among PLT-I, PLT-O and PLT-F methods. (C) Interpretation of very low platelet counts requires appropriate concentration-specific performance evidence, identification of the counting method, and assessment of potential analytical interference.
View full sizeWhere does RCV fit?
Reference change value (RCV) addresses a different question: how large a change between two serial patient results must be before it is unlikely to reflect analytical and within-subject biological variation alone?
For the conventional symmetric model:
RCV = Z × √2 × √(CVA² + CVI²)
Where CVA represents suitable analytical imprecision and CVI represents within-subject biological variation.
Analytical variability therefore contributes to both MU estimation and RCV calculations.
But expanded U should not simply be inserted into the RCV formula in place of CVA.
The formula also requires suitable assumptions about the analytical process, biological variation, and the relationship between serial measurements.
If successive patient results are obtained on different analysers, a systematic inter-analyser difference may affect the observed delta. This must be considered separately rather than automatically treated as random analytical variation.
For a practical investigation of unexpected CBC changes, see Delta Checks in Haematology: When a Result Changes Too Much.
8. What MU Can—and Cannot—Tell Us
A well-designed MU estimate provides useful information about the reliability of a defined measurement process.
But its value depends on what the data actually represent.
IQC materials are not patient samples
Commercial control materials are designed for routine quality monitoring.
Their composition, stabilisation, and behaviour may differ from those of fresh patient specimens.
Even if a control material is stable and produces an excellent CV, that does not prove the same uncertainty across every type of patient sample.
Conversely, deterioration of stabilised cellular material may increase IQC variation without causing a corresponding deterioration in patient measurements.
This is why the suitability of IQC data must be considered rather than assumed.
MU is not a substitute for investigating interference
A patient sample with cold agglutination, platelet clumping, marked lipaemia, or another significant analytical interference may behave differently from the samples and control materials represented by the routine uncertainty estimate.
The interference may create a systematic error that is not adequately covered by the validated MU model.
An uncertainty calculation cannot legitimise a result affected by an unresolved analytical problem.
Where an abnormal result or analyser flag suggests interference, investigation takes priority over applying a routine uncertainty interval.
MU does not automatically include preanalytical variation
Patient identification, collection technique, specimen handling, storage, and transport may influence the quality of a laboratory result.
However, these sources are not necessarily represented in an MU estimate derived from analyser IQC.
A routine analytical MU should therefore not be interpreted as a comprehensive statement about every stage of the total testing process.
The distinction between analytical uncertainty and other sources of variation must remain explicit.
MU may vary with concentration and measurement method
A single percentage may provide a useful summary over a validated working interval.
It should not automatically be assumed constant across the complete analytical measuring range.
This is particularly important for low platelet counts and other measurements where imprecision changes substantially with concentration.
Similarly, a change in measurement channel or procedure may require a separate uncertainty assessment.
The appropriate scope of the MU estimate should be documented and understood by those interpreting it.
9. Maintaining MU and Putting It to Work
Measurement uncertainty is not a calculation that should be performed once and then forgotten.
A laboratory's measurement process evolves.
New reagent lots are introduced. Calibrations are performed. Instrument components are replaced. Software and analytical methods may change. QC materials age and are eventually replaced by new lots.
Some changes may have little impact on patient results. Others may alter imprecision, bias, or the uncertainty budget.
The laboratory must be able to distinguish between them.
When should MU be reviewed?
An MU estimate should be reviewed periodically and when evidence suggests that the underlying measurement process has changed materially.
Relevant triggers may include:
- Sustained changes in long-term IQC precision or trends.
- Reagent or calibrator changes associated with demonstrable performance differences.
- Major maintenance or analyser replacement.
- Significant inter-analyser disagreement.
- Changes to measurement methods, analytical channels, or calibration traceability.
- New evidence showing that an existing MU estimate is unsuitable for a clinically important concentration range.
A routine reagent or QC lot change does not necessarily require rebuilding the complete MU model from the beginning.
However, the laboratory should assess whether the change affects the validity of its current estimate.
What does ISO 15189 require?
ISO 15189:2022, Section 7.3.4 [8], addresses the evaluation of measurement uncertainty.
Where relevant, laboratories are expected to evaluate and maintain MU for its intended use, compare it with appropriate performance specifications, document the evaluation, review it regularly, and make uncertainty information available to laboratory users on request.
Where an MU evaluation is not possible or relevant, the reason for exclusion should be documented.
ISO/TS 20914:2019 [7] provides practical guidance for estimating and expressing MU in medical laboratories.
CLSI EP29-A [9] also provides useful background on top-down and bottom-up approaches, although it is an archived guideline and should be treated as a supplementary reference rather than a current primary standard.
From a calculated value to a defensible laboratory estimate
A practical MU record should identify the measurand, analyser or measurement process, concentration range, data period, included IQC and reagent lots, pooling method, uncertainty components, performance specification, assumptions, and review status.
It should also document how patient-relevant systematic changes were evaluated and whether any uncertainty components remain unavailable.
The objective is not to produce the smallest possible percentage.
It is to produce an estimate that accurately represents the measurement process and can be defended when its clinical relevance is questioned.
A low CV calculated from carefully selected data may look impressive but offer little value if important routine variation has been removed.
A larger, well-supported uncertainty estimate may be more informative because it reflects the real performance of the laboratory.
Ultimately, MU should help the laboratory identify where analytical improvement is needed, assess whether results are fit for their intended use, and communicate the limitations of measurement when those limitations matter.
A reliable CBC result is not simply one that passes QC. It is a result produced by a controlled measurement process whose performance—and uncertainty—the laboratory understands.
References
- Miller WG. The role of analytical performance specifications in international guidelines and standards dealing with metrological traceability in laboratory medicine. Clin Chem Lab Med. 2024;62(8):1462–1469. https://doi.org/10.1515/cclm-2023-1201
- Sandberg S, Coskun A, Carobene A, et al. Analytical performance specifications based on biological variation data—considerations, strengths and limitations. Clin Chem Lab Med. 2024;62(8):1483–1489. https://doi.org/10.1515/cclm-2024-0108
- Oosterhuis WP, Coskun A, Sandberg S, Mikailova P, Theodorsson E. Measurement uncertainty for practical use—applied in hematology. Clin Chim Acta. 2026;578:120546. https://doi.org/10.1016/j.cca.2025.120546
- Kim SJ, Lee EY, Song YJ, Song J. The instability of commercial control materials in quality control of mean corpuscular volume. Clin Chim Acta. 2014;434:11–15. https://doi.org/10.1016/j.cca.2014.04.004
- Schoorl M, Schoorl M, Oomes J, van Pelt J. New fluorescent method (PLT-F) on Sysmex XN2000 hematology analyzer achieved higher accuracy in low platelet counting. Am J Clin Pathol. 2013;140(4):495–499. https://doi.org/10.1309/AJCPUAGGB4URL5XO
- European Federation of Clinical Chemistry and Laboratory Medicine. EFLM Biological Variation Database. Haemoglobin (Hb), whole-blood meta-analysis. Accessed November 10, 2026. https://biologicalvariation.eu/meta_calculations
- International Organization for Standardization. ISO/TS 20914:2019. Medical laboratories—Practical guidance for the estimation of measurement uncertainty. https://www.iso.org/standard/69445.html
- International Organization for Standardization. ISO 15189:2022. Medical laboratories—Requirements for quality and competence. Section 7.3.4. https://www.iso.org/standard/76677.html
- Clinical and Laboratory Standards Institute. EP29-A: Expression of Measurement Uncertainty in Laboratory Medicine. 2012. Archived guideline. https://clsi.org/shop/standards/ep29/
- Rigo-Bonnin R, Díaz-Troyano N, García-Tejada L, Marcè-Galindo A, Valbuena-Asensio M, Canalias F. Estimation of the measurement uncertainty and practical suggestion for the description of the metrological traceability in clinical laboratories. Biochem Med (Zagreb). 2021;31(1):010501. https://doi.org/10.11613/BM.2021.010501
- Sysmex America. The Influence of RBC Counting Technology on MCHC Results. Hematology White Paper. https://www.sysmex.com/en-us/training-and-knowledge/knowledge/hematology-white-paper---the-influence-of-rbc-counting
- Sysmex Corporation. XN-L Series XN-530/XN-430/XN-330: General Information. Revision April 2020. Document code AC044589 en-eu. Chapter 5, section 5.6.3, p. 72. https://moodle.fondation-merieux.org/pluginfile.php/5037/mod_resource/content/1/XN-L_x30_GeneralInformation_2004_en.pdf