1. The EQA Report Has Arrived
The latest External Quality Assessment (EQA) report arrives in the laboratory.
Haemoglobin is satisfactory. The platelet count falls within the provider’s acceptance limits. The white blood cell count has also passed.
Everything looks fine.
The report is reviewed, signed and filed. Another EQA cycle is complete.
But before moving on, there is a question worth asking:
Does passing EQA mean that our patient results are accurate?
Not necessarily.
A satisfactory EQA result provides evidence about laboratory performance in a defined external assessment. It does not establish that every patient result is accurate, that clinically important bias is absent, or that analytical performance will remain stable between EQA distributions.
Even a good result needs context.
What was the assigned value? Which laboratories formed the comparison group? What performance specification was applied? And did the EQA material behave like the patient samples we normally analyse?
These questions matter because an acceptable score and reliable patient results are related, but they are not interchangeable.
EQA becomes more valuable when we look beyond the final classification and examine what the findings actually tell us about our analytical system.
2. What EQA Actually Evaluates
External Quality Assessment provides a structured means of comparing laboratory performance with externally established expectations. It is part of the broader framework for assuring the quality and competence of medical laboratory examinations [1].
Proficiency Testing (PT) commonly involves distributing test materials to participating laboratories and evaluating their results against predetermined criteria. ISO/IEC 17043:2023 addresses the competence and operation of PT providers [2].
For quantitative examinations, results may be evaluated against an assigned value obtained through an appropriate reference measurement procedure, participant consensus, a method-specific peer group or expert laboratory results. Statistical approaches for establishing and interpreting these comparisons are discussed in ISO 13528 [3].
EQA and PT are closely related terms, and their use may vary across programmes and regulatory settings. CLSI guideline QMS24 addresses how laboratories can use PT results as part of quality improvement rather than treating participation as an isolated administrative exercise [4].
EQA is not the same as IQC
Internal Quality Control (IQC) and EQA examine laboratory performance from different perspectives.
| Feature | Internal Quality Control | EQA / PT |
|---|---|---|
| Primary purpose | Monitor routine analytical stability | Evaluate performance through an external comparison |
| Typical frequency | Frequent or routine | Periodic, according to the programme |
| Main comparison | Laboratory control limits | Assigned value and defined assessment criteria |
| Particular strength | Detect changes during ongoing testing | Reveal differences from external expectations |
| Important limitation | Does not independently establish trueness | Does not continuously monitor patient testing |
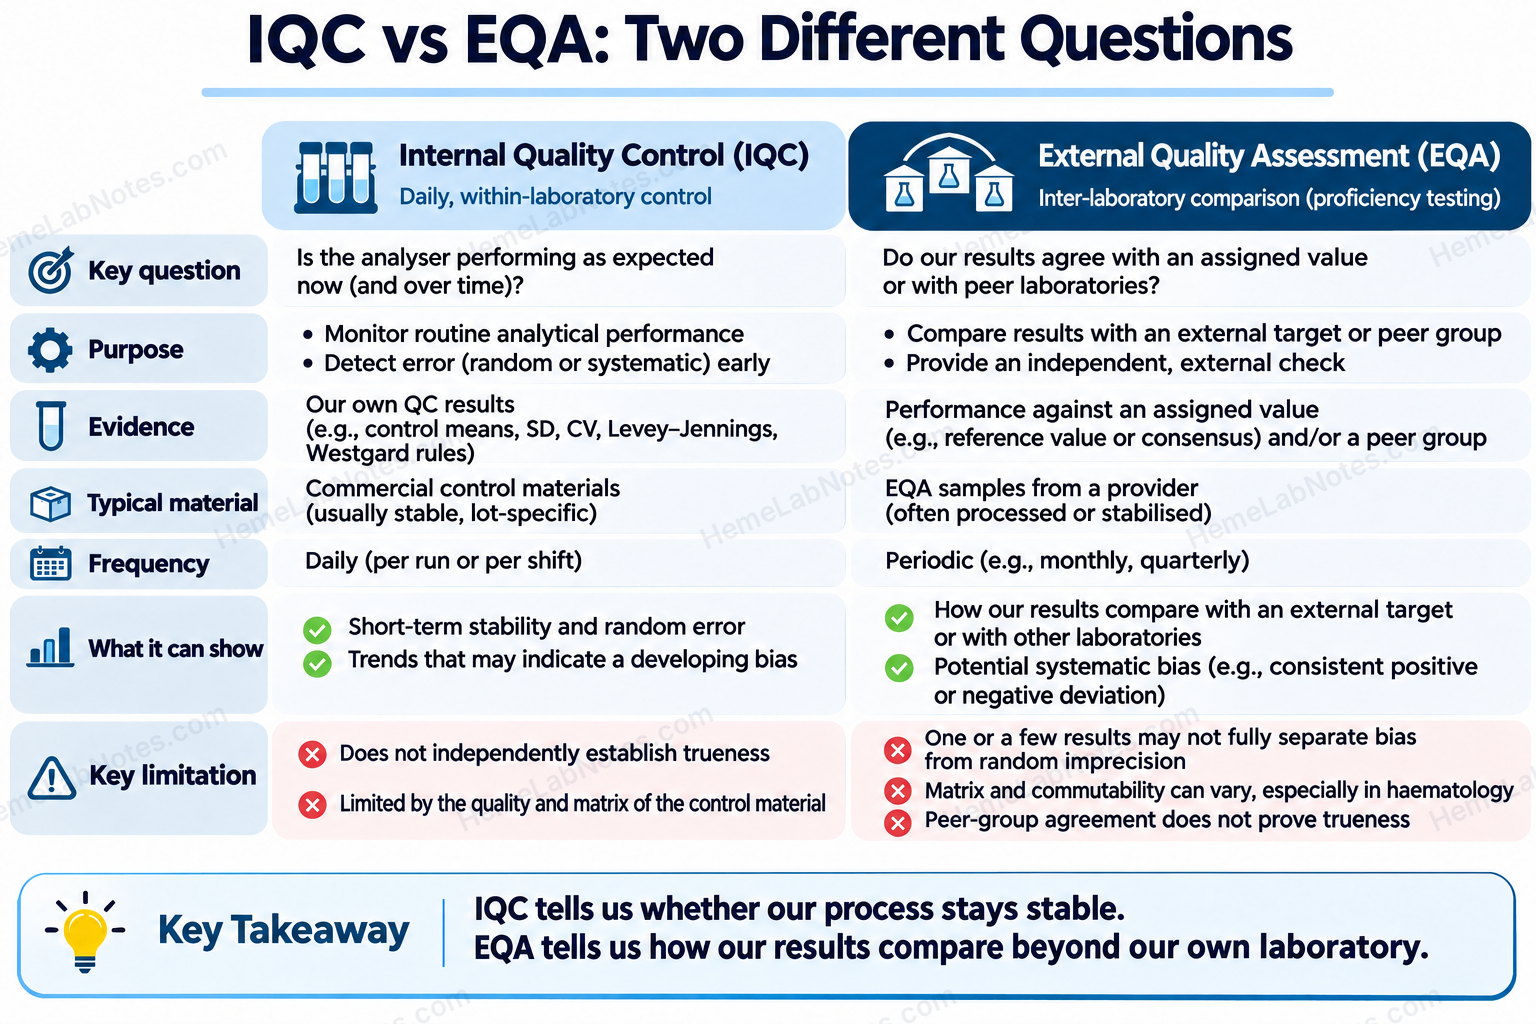
Figure 1. IQC and EQA answer different analytical-quality questions.
View full sizeA laboratory can maintain stable IQC while producing results that differ consistently from an appropriate external reference.
Conversely, a satisfactory EQA result does not guarantee that analytical performance will remain unchanged throughout the next month.
Both are needed, together with suitable verification, comparability studies and other quality assurance measures.
Are EQA samples handled like patient samples?
This is a particularly important part of the assessment.
ISO 15189:2022, Clause 7.3.7.3, addresses EQA participation and the involvement of personnel who routinely carry out laboratory examination processes [1].
The underlying objective is straightforward: an EQA exercise should provide meaningful evidence about the laboratory’s actual testing process.
Consider a laboratory that routinely performs CBC testing on two analysers.
If EQA material is always assigned to the preferred analyser, repeatedly measured until an attractive result is obtained, or processed differently from routine patient specimens without a valid programme requirement, the result may no longer adequately represent everyday practice.
EQA specimens should be handled by appropriate routine personnel, following the provider’s instructions and the laboratory’s approved procedures. Special handling or repeat measurements should not be introduced simply to improve the submitted score.
Some EQA materials require specific handling because their characteristics differ from fresh patient blood. Such instructions must still be followed, and their implications for result interpretation should be recognised.
What if the laboratory has more than one analyser?
A single satisfactory EQA result from one analyser does not, by itself, prove that every analyser in the laboratory produces comparable patient results.
ISO 15189:2022, Clause 7.3.7.4, addresses comparability where different equipment, methods or testing locations are involved [1].
For example, a dual-analyser or dual-module haematology service may need additional evidence that results remain sufficiently comparable across its available testing pathways.
Depending on the arrangement, that evidence may come from separately assessed EQA participation, appropriately designed patient-sample comparisons or other suitable procedures.
EQA participation and inter-analyser comparability address related but distinct questions.
Passing EQA on one testing pathway should not be interpreted as automatic verification of every other pathway.
3. Reading Beyond the Pass or Fail
Before deciding whether an EQA result is satisfactory, we need to understand how the provider evaluated it.
Four questions are especially useful.
What is the assigned value?
An assigned value based on an appropriate reference procedure carries different implications from a value obtained through participating laboratory consensus.
Which laboratories were included?
An all-method comparison and a method-specific peer-group comparison may assess different aspects of performance.
What performance specification was used?
Different EQA programmes may apply different analytical performance specifications (APS), even for the same parameter.
What analytical property is being assessed?
An evaluation of a single result against an acceptance limit should not automatically be interpreted as a precise estimate of long-term bias.
Jones and colleagues emphasised the importance of understanding the EQA material, assigned value, analytical property and rationale for the performance specification when interpreting EQA results [5].
Worked example: A platelet count that passes
Consider the following hypothetical EQA result:
| Item | Illustrative value |
|---|---|
| Parameter | PLT |
| Assigned value | 33.0 × 10⁹/L |
| Laboratory result | 35.8 × 10⁹/L |
| Absolute difference | +2.8 × 10⁹/L |
| Percentage deviation | +8.5% |
| Hypothetical acceptance limit | ±12% |
| EQA classification | Satisfactory |
The percentage deviation is:
Deviation (%) = [(Laboratory result − Assigned value) / Assigned value] × 100
Substituting the values:
Deviation = [(35.8 − 33.0) / 33.0] × 100 = +8.48%, approximately +8.5%.
The result falls within the hypothetical acceptance limit.
But does that mean the difference is analytically or clinically unimportant?
Not automatically.
An individual EQA result reflects any systematic difference, together with random measurement variation and other sources of uncertainty relevant to that assessment.
One EQA measurement cannot reliably separate systematic bias from random imprecision [5].
At a platelet concentration near 30 × 10⁹/L, even a seemingly modest absolute difference may deserve attention, particularly when results approach clinically important decision thresholds.
We must also consider whether the difference is representative of fresh patient specimens.
The purpose of reviewing the deviation is not to declare a satisfactory result unacceptable.
It is to understand the evidence and determine whether additional investigation would be worthwhile.
Educational note: All values, including the ±12% acceptance limit, are hypothetical. They do not represent a particular EQA provider or a universal platelet performance specification.
Understanding the EQA z-score
Some PT programmes use a standardised score to express how far a participant’s result lies from the assigned value relative to a defined standard deviation.
A common z-score calculation is:
z = (x − x_pt) / σ_pt
Where:
- x = participant’s reported result
- x_pt = assigned value
- σ_pt = standard deviation for proficiency assessment
A conventional interpretation is:
| Absolute z-score | Interpretation |
|---|---|
| ≤ 2 | Satisfactory |
| > 2 and < 3 | Warning signal |
| ≥ 3 | Action signal |
This is a general PT scoring framework, not a universal requirement for every clinical EQA scheme [3].
The standard deviation used for proficiency assessment is not necessarily the participant laboratory’s own analytical SD. It may be selected or derived according to the programme’s assessment design.
Likewise, an EQA z-score should not automatically be treated as identical to an SDI reported by another programme without checking its definition.
Some providers use percentage deviation, allowable limits, different scoring models or combinations of assessment criteria.
Always interpret the score according to the specific provider’s stated methodology.
4. Peer-Group Agreement Is Not the Same as Trueness
One of the most important distinctions in EQA is the difference between agreeing with similar analysers and agreeing with an independently assigned reference value.
Peer-group comparison
Imagine a group of laboratories using closely related haematology analysers.
Their results cluster tightly around a common value.
Our laboratory reports a result close to that peer-group centre and receives a satisfactory assessment.
That provides useful evidence of agreement with the selected peer group.
But it does not necessarily establish that the peer-group centre is free from bias.
If all members of the group share a systematic difference from an appropriate independent reference, their close agreement may conceal that common difference.
This is a limitation of consensus-based comparison, not evidence that any particular instrument family is inaccurate.
Reference-based comparison
An appropriately established, independent reference value can provide stronger evidence regarding trueness.
However, reference measurement procedures are not available for every CBC parameter and every practical EQA setting.
In haematology, established reference approaches include the haemiglobincyanide method for haemoglobin and immunological flow-cytometric platelet counting based on a platelet-to-red-cell ratio [6].
These approaches are analytically important, but they do not make reference-based assessment readily available for the complete range of automated CBC parameters.
The choice of EQA material and the methods used to evaluate it also influence the available comparisons.
De la Salle described how the characteristics and stability limitations of blood-cell material complicate the assessment of automated haematology systems [6].
Consequently, many quantitative haematology EQA exercises rely on appropriately defined method or instrument peer groups.
This can make performance assessment more meaningful for processed materials that do not behave identically across different analyser technologies.
But peer-group results must be described for what they are: evidence of agreement within a defined comparison population.
They are not necessarily direct measurements of trueness.
5. Commutability: Does EQA Material Behave Like Patient Blood?
EQA materials are not always equivalent to fresh patient samples.
This is where commutability becomes important.
A material is commutable for particular measurement procedures when its behaviour across those procedures is sufficiently consistent with the relationships observed for relevant patient samples.
CLSI EP14 addresses the evaluation of processed materials, while Sandberg and colleagues provide recommendations for assessing commutability in EQA and PT settings [7,8].
In practical laboratory terms, the question is:
If two analysers give different results on the EQA material, would we expect the same difference when testing comparable patient specimens?
The answer depends partly on how the EQA material was prepared.
Fresh EDTA-anticoagulated blood resembles routine CBC specimens but has limited stability for distribution over long distances.
Stabilised material may remain suitable for testing over a longer period, but processing can change cellular properties.
Chemical fixation, for example, may alter red-cell membranes and the way cells interact with different counting technologies.
De la Salle reported that aldehyde-based stabilisation can cause noncommutability across analyser platforms, notably affecting MCV, WBC and platelet measurements [6].
This creates an important interpretive limitation.
A discrepancy between two analysers using stabilised EQA material may not accurately represent their difference when analysing fresh clinical specimens.
It is equally important not to assume that every unexpected result is a matrix effect.
That explanation requires appropriate supporting evidence.
Where material commutability has been established for relevant methods and measurands, inter-method comparisons may support stronger conclusions.
Where it is uncertain or limited, the interpretation should be more cautious.
A difference in EQA material is not automatically a difference in patient results.
That distinction matters particularly when laboratories operate more than one haematology analyser or compare results across analytical platforms.
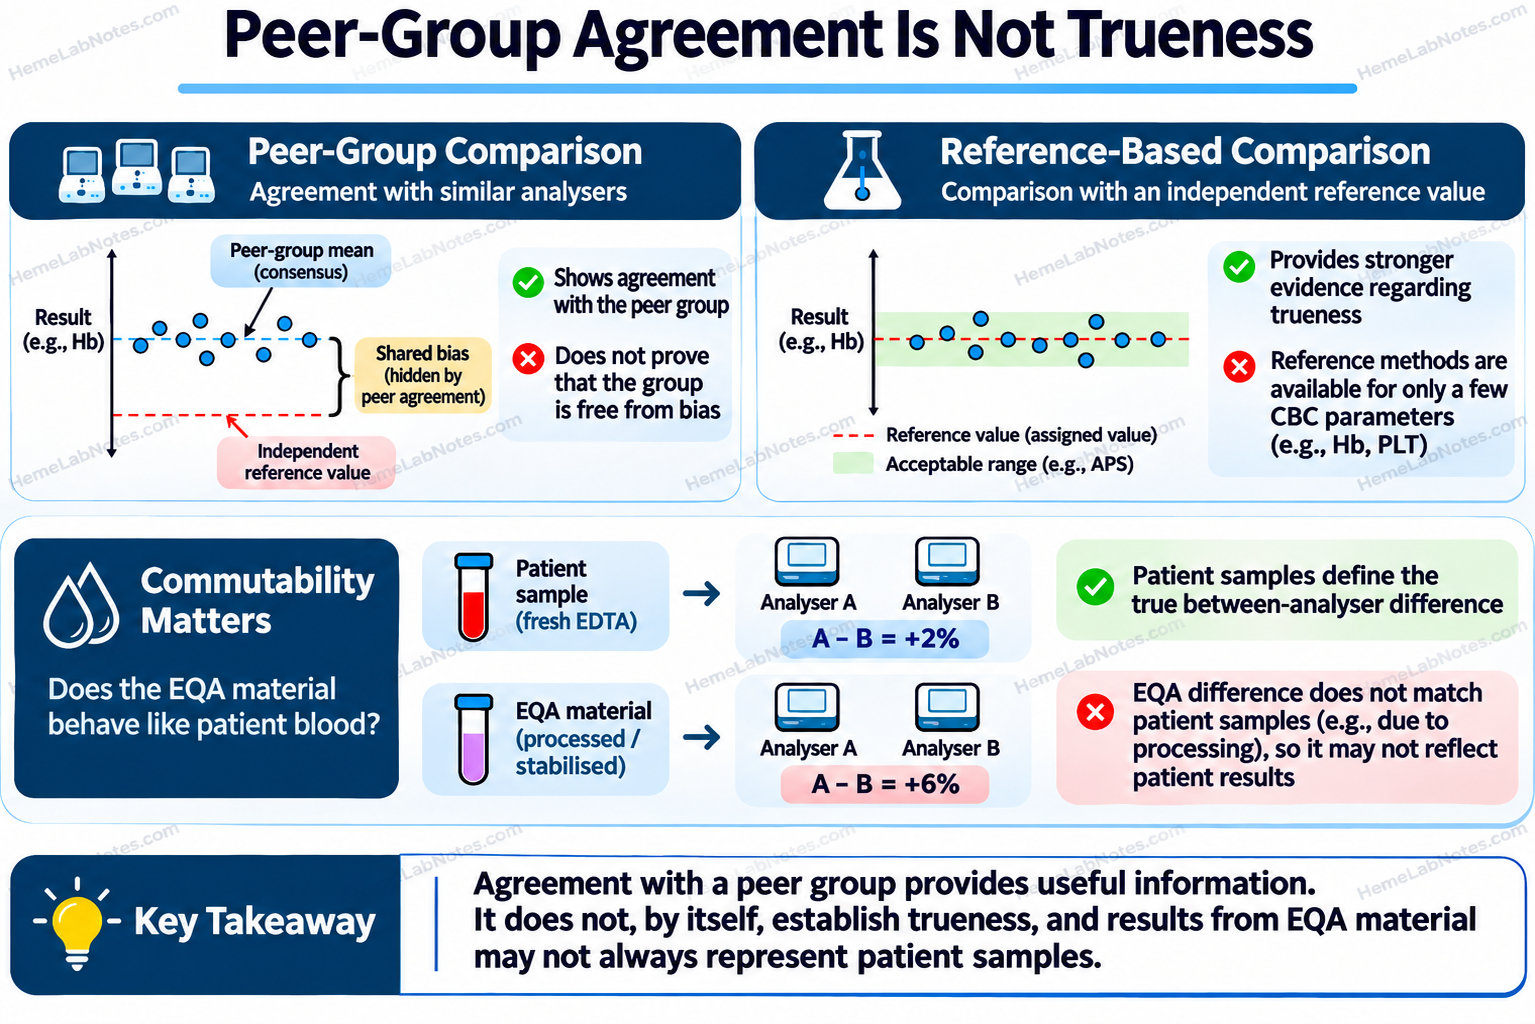
Figure 2. Peer-group agreement, reference-based comparison and EQA material commutability.
View full size6. The Haematology Perspective: Different Parameters, Different Limitations
The CBC is a collection of related measurements, but its parameters do not all present the same analytical challenges.
Understanding the measurement pathway is essential when reviewing EQA performance.
Haemoglobin
Haemoglobin measurement is generally highly repeatable on modern automated systems, but consistent differences between instruments can still matter.
An analyser may demonstrate stable IQC while producing a slightly higher or lower haemoglobin result than another analytical system.
When repeated EQA results show differences in the same direction, appropriate patient-sample comparisons may help determine whether a clinically relevant systematic difference exists.
An apparently small percentage difference should be interpreted in relation to the applicable clinical decision points and analytical performance specifications.
Platelet count
Platelet enumeration deserves particular attention at low concentrations.
A difference between 30 and 35 × 10⁹/L may have a different clinical context from the same absolute difference at a substantially higher platelet concentration.
It is also important to know which analytical pathway generated the result.
Depending on the analyser, platelet counts may be available from impedance, optical or fluorescence-based methods.
When an EQA programme requires a particular reporting mode, its instructions must be followed.
Otherwise, the laboratory should document the channel or method used and, where appropriate, assess performance using the same pathway normally relied upon for patient reporting.
Selecting a different mode solely because it produces a more favourable EQA result can reduce the assessment’s relevance to routine clinical practice.
Processing and stabilisation of EQA material can also affect platelet counting methods differently [6].
White blood cell count
Low WBC concentrations require careful interpretation because small absolute differences may produce comparatively large percentage deviations.
For example, a difference of 0.2 × 10⁹/L represents 2% at a concentration of 10.0 × 10⁹/L, but 20% at 1.0 × 10⁹/L.
The absolute difference, percentage difference and clinical concentration range should therefore be considered together.
Where stabilised materials are used, inter-method differences may also reflect the effects of cell preparation rather than the performance of patient testing alone [6].
MCV and the red-cell indices
MCV requires particular caution in haematology EQA.
Different analyser designs may derive red-cell volume and haematocrit through different measurement and calculation pathways.
Some platforms determine MCV from individual red-cell volume measurements and calculate haematocrit from the RBC count and MCV. Other technologies may determine haematocrit from a red-cell volume distribution and derive MCV.
MCHC is generally calculated using haemoglobin and haematocrit. Consequently, a difference in a measured component can influence related calculated indices [9].
The EQA material introduces an additional complication.
Red-cell stabilisation can affect volume-related measurements and produce differences between analyser platforms that do not reliably reflect fresh patient-sample performance [6].
For this reason, inter-platform MCV differences observed with processed EQA material should not automatically be interpreted as evidence of patient-sample bias.
Where a clinically important difference is suspected, a suitable patient-sample comparability study may provide more relevant evidence.
Blood film morphology
Haematology EQA extends beyond quantitative CBC parameters.
Morphology exercises may assess the identification of abnormal cells, blood-film interpretation or other qualitative aspects of laboratory competence.
These programmes examine professional recognition and interpretive performance rather than the same statistical properties evaluated in a quantitative cell-counting exercise.
Their assessment criteria, limitations and corrective actions must therefore be interpreted within their own programme design.
7. When Everything Passes but a Pattern Emerges
Imagine that our laboratory receives the following haemoglobin EQA results across three successive distributions.
| Distribution | Deviation from assigned value | EQA status |
|---|---|---|
| Round 1 | +1.7% | Satisfactory |
| Round 2 | +2.1% | Satisfactory |
| Round 3 | +2.0% | Satisfactory |
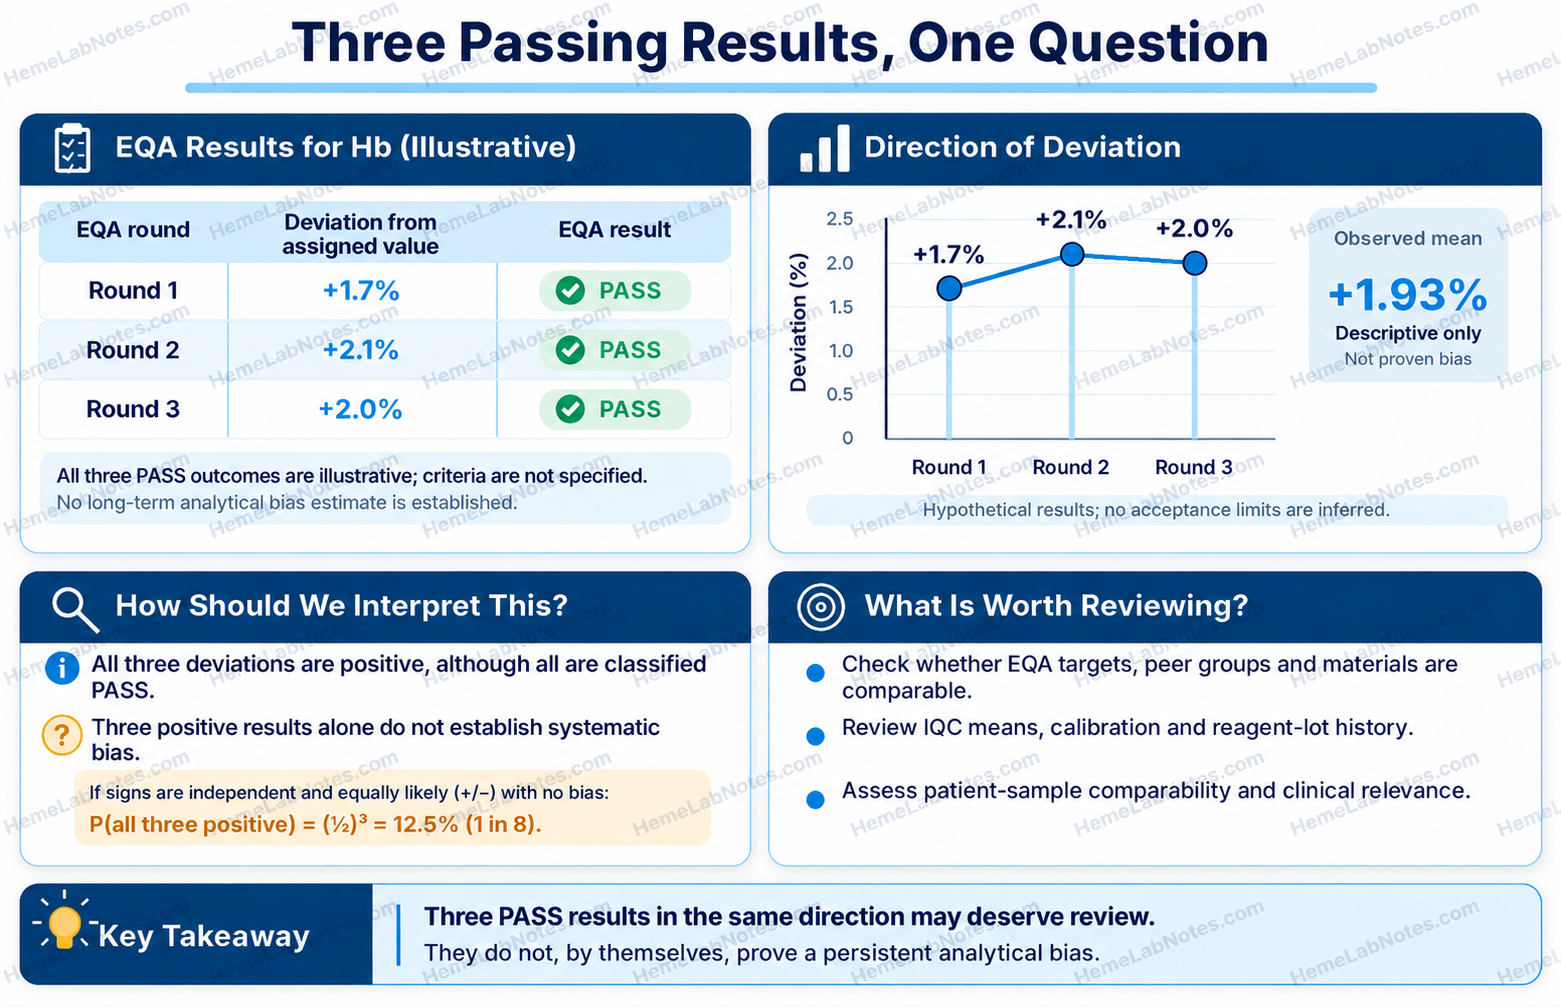
Figure 3. Three satisfactory Hb EQA results with positive deviations; the pattern warrants interpretation but does not prove persistent bias.
View full sizeEvery result is acceptable under the hypothetical provider’s criteria.
There is no EQA failure.
However, all three deviations are positive.
Their average is:
Mean deviation = (1.7 + 2.1 + 2.0) / 3 = +1.93%, approximately +1.9%.
Could this suggest a persistent positive analytical bias?
Possibly, but the pattern alone is insufficient evidence.
Three positive results are not proof of bias
Under a simplified model in which the laboratory has no systematic bias, deviations are independent and positive or negative signs are equally likely, the probability of obtaining three positive deviations is:
P = (0.5)³ = 0.125 = 12.5%.
The probability of three deviations all having the same sign, whether positive or negative, would be 25% under those assumptions.
These illustrative probabilities are not a formal assessment of the EQA sequence.
Real distributions may involve different assigned values, concentration ranges, material properties and correlated sources of error.
Nevertheless, the example demonstrates why three positive results may attract attention without establishing a systematic analytical problem.
What should we investigate?
Before interpreting the apparent pattern, we should ask whether the three distributions used comparable target assignments, peer groups, assessment methods and material characteristics.
If the comparisons are sufficiently consistent, the observations may justify reviewing the laboratory’s other performance evidence.
Useful information could include previous EQA history, IQC means, calibration and maintenance records, reagent lot changes and suitable patient-sample comparisons.
The laboratory should also interpret any estimated bias against a clinically justified, predefined APS.
Specifications based on biological variation, one of the Milan models, may be relevant where appropriate. The choice of specification and the evidence supporting the bias estimate should be considered carefully [5].
The approximate +1.9% mean deviation is a descriptive observation, not a validated long-term bias estimate.
It should not be used alone to determine whether the analyser satisfies a desirable bias specification.
This is where EQA connects naturally with trend recognition, IQC interpretation and lot-to-lot verification.
A satisfactory score tells us the result met the assessment criterion. A repeated pattern may tell us what deserves closer examination.
8. What Should We Do When EQA Is Unsatisfactory?
An unsatisfactory EQA result requires investigation.
The objective is not simply to obtain a better number on repeat analysis. It is to identify whether a genuine analytical or process-related problem occurred and determine whether patient results could have been affected.
CLSI QMS24 provides a framework for laboratories to use PT within their quality management processes, while ISO 15189 addresses the management of nonconforming work and potential patient impact [1,4].
A practical investigation can be organised around five questions.
Was the correct result submitted?
Review the specimen identification, units, analyser assignment, reporting channel, result transcription and submission process.
A reporting error may lead to an unacceptable EQA assessment even if the analytical measurement was satisfactory.
Was the material handled correctly?
Review preparation instructions, mixing procedures, storage conditions, sample integrity, instrument flags and relevant analytical events.
EQA material may have handling requirements that differ from fresh patient blood.
Those requirements must be considered before attributing an abnormal result to the instrument.
Is there evidence of a broader analytical problem?
Examine relevant IQC records, calibration history, maintenance events and reagent lot changes.
Where appropriate, compare results between instruments using suitable clinical specimens.
A finding confined to one processed EQA sample may require a different investigation from a persistent analytical shift affecting routine patient testing.
Could patient results have been affected?
This is the central clinical question.
If the investigation suggests an analytical problem that could have affected patient examinations, the laboratory should evaluate the relevant period, affected testing pathways and potential clinical consequences.
Any result review, correction, escalation or notification should follow approved laboratory procedures and applicable requirements.
The review should be proportionate to the suspected problem and the associated clinical risk.
Has the corrective action been effective?
Corrective action should address an identified cause where one can be established.
When the cause remains uncertain, the laboratory should document that uncertainty and determine what additional monitoring or evidence is necessary.
Subsequent IQC performance, suitable verification testing, patient-sample comparisons and future EQA results may contribute to evaluating effectiveness.
A single satisfactory subsequent EQA result does not necessarily demonstrate that every possible cause has been resolved.
An effective investigation should leave the laboratory with better evidence about the reliability of its testing process, not merely a completed corrective-action form.
9. From EQA Compliance to Better Laboratory Decisions
EQA is more useful when treated as evidence rather than a pass-or-fail exercise.
A satisfactory result is reassuring, but its meaning depends on the assessment design, comparison group, target assignment, analytical specification and characteristics of the test material.
An unsatisfactory result is important, but the score alone does not identify the cause.
Likewise, agreement with a peer group does not automatically establish trueness, and differences involving processed materials do not necessarily represent differences in fresh patient samples.
For the haematology laboratory, the most useful interpretation considers the entire analytical picture.
That includes IQC, historical EQA performance, measurement pathways, patient-sample comparability, reagent lot verification and the clinical importance of any identified differences.
The objective is not simply to satisfy an external assessment programme.
It is to understand whether our analytical systems produce results that are sufficiently reliable for their intended clinical use.
The practical takeaway
Passing EQA provides evidence that a laboratory met defined external assessment criteria.
It does not, by itself, prove that every patient result is accurate or that every analyser in the laboratory performs identically.
The real value comes from understanding what the assessment demonstrates, recognising its limitations and using the findings to improve laboratory practice.
Read the pattern. Then read the patient.
References
-
International Organization for Standardization. ISO 15189:2022 — Medical laboratories: Requirements for quality and competence. 4th ed. Geneva: ISO; 2022. https://www.iso.org/standard/15189
-
International Organization for Standardization / International Electrotechnical Commission. ISO/IEC 17043:2023 — Conformity assessment: General requirements for the competence of proficiency testing providers. 2nd ed. Geneva: ISO; 2023. https://www.iso.org/standard/80864.html
-
International Organization for Standardization. ISO 13528:2022 — Statistical methods for use in proficiency testing by interlaboratory comparison. 3rd ed. Geneva: ISO; 2022. Amendment 1:2026. https://www.iso.org/standard/78879.html ; https://www.iso.org/standard/90057.html
-
Clinical and Laboratory Standards Institute. CLSI guideline QMS24 — Using Proficiency Testing and Alternative Assessment to Improve Medical Laboratory Quality. 3rd ed. Wayne, PA: CLSI; 2016. Reaffirmed May 2021. https://clsi.org/shop/standards/qms24/
-
Jones GRD, Albarede S, Kesseler D, et al. Analytical performance specifications for external quality assessment — definitions and descriptions. Clin Chem Lab Med. 2017;55(7):949–955. https://doi.org/10.1515/cclm-2017-0151
-
De la Salle B. Survey material choices in haematology EQA: a confounding factor in automated counting performance assessment. Biochem Med (Zagreb). 2017;27(1):63–72. https://doi.org/10.11613/BM.2017.008
-
Clinical and Laboratory Standards Institute. CLSI EP14 — Evaluation of Commutability of Processed Samples. 4th ed. Wayne, PA: CLSI; 2022. Reaffirmed August 2026. https://clsi.org/shop/standards/ep14-plus/
-
Sandberg S, Fauskanger P, Johansen JV, et al.; IFCC Working Group on Commutability in Metrological Traceability. Recommendations for Setting a Criterion and Assessing Commutability of Sample Materials Used in External Quality Assessment/Proficiency Testing Schemes. Clin Chem. 2023;69(11):1227–1237. https://doi.org/10.1093/clinchem/hvad135
-
Marin MJ, van Wijk XMR, Boothe PD, Harris NS, Winter WE. An Introduction to the Complete Blood Count for Clinical Chemists: Red Blood Cells. J Appl Lab Med. 2024;9(5):1025–1039. https://doi.org/10.1093/jalm/jfae031