The platelet count was 243 ×10³/µL yesterday.
Today, it is 81 ×10³/µL.
The analyser has completed the measurement. The haemoglobin, white blood cell count and red-cell indices look almost unchanged.
Only the platelet count has fallen dramatically.
Is this a genuine change in the patient’s condition, or is something wrong with the specimen?
A delta check can bring this discrepancy to our attention. But the alert cannot explain why it happened.
That requires investigation.
1. When Yesterday’s CBC Does Not Match Today’s
Consider an adult inpatient with two complete blood counts (CBCs) collected 24 hours apart.
Both specimens were collected into K₂-EDTA tubes and analysed 40 minutes after collection.
Table 1. Previous and current CBC results
| Parameter | Day 5 | Day 6 |
|---|---|---|
| WBC (×10³/µL) | 6.8 | 6.7 |
| RBC (×10⁶/µL) | 4.62 | 4.59 |
| Hb (g/dL) | 13.7 | 13.6 |
| Hct (%) | 40.9 | 40.7 |
| MCV (fL) | 88.5 | 88.6 |
| MCH (pg) | 29.7 | 29.6 |
| MCHC (g/dL) | 33.5 | 33.4 |
| PLT (×10³/µL) | 243 | 81 |
All results are independently constructed synthetic educational data. They do not represent an actual patient.
Most of the CBC is remarkably stable.
The platelet count, however, has fallen by approximately 67%.
Depending on the laboratory’s critical-value threshold, 81 ×10³/µL may not trigger a critical-value notification. Yet the change from the previous result may require investigation before release.
Without an appropriately configured delta rule or another review trigger, this result might even pass routine autoverification.
That is where a delta check becomes useful.
It draws attention to a difference that might otherwise go unnoticed.
But a large change is not necessarily an incorrect result.
And a plausible result is not necessarily correct.
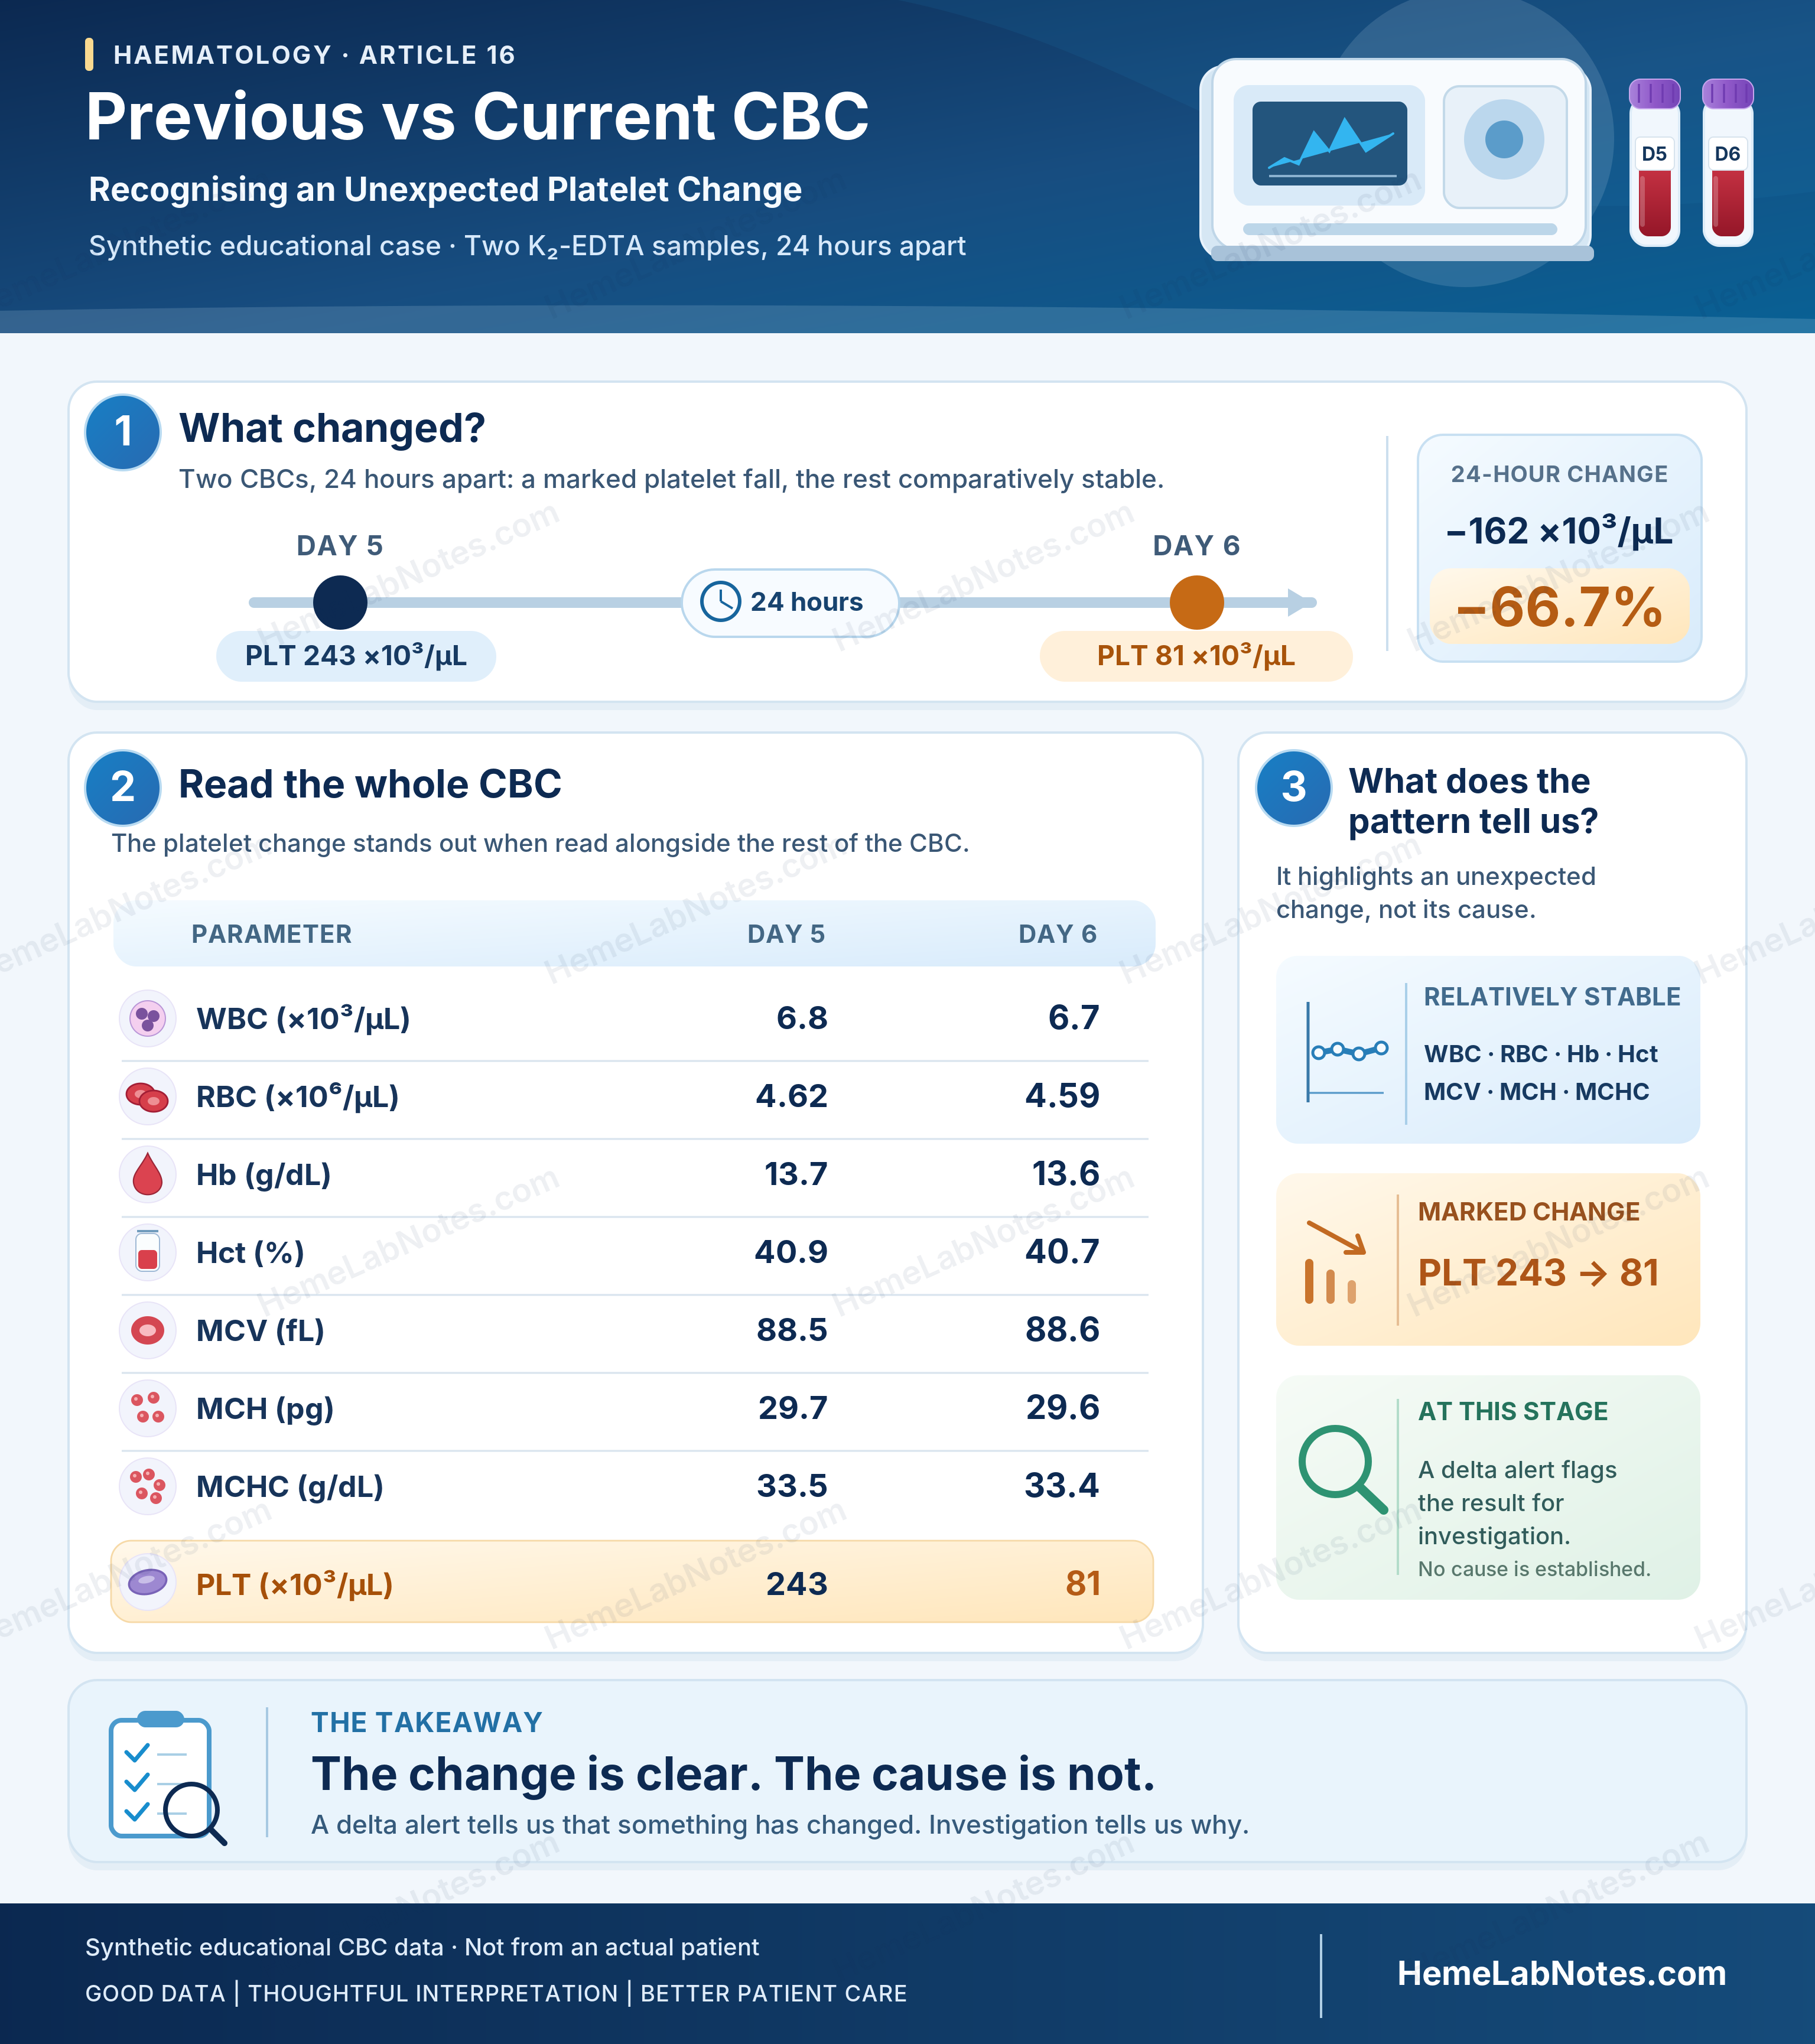
Two CBC results collected 24 hours apart show a marked isolated platelet reduction, while the remaining parameters are comparatively stable. The delta alert identifies a change requiring investigation but does not establish its cause.
View full size2. What a Delta Check Can and Cannot Tell Us
A delta check compares a patient’s current laboratory result with a previous result and evaluates whether the difference exceeds predefined criteria.
Delta checks have two important purposes.
The first is to identify possible specimen or laboratory problems, including misidentification, contamination, compromised specimens and analytical interference.
The second is to recognise potentially important changes in the patient’s clinical condition.
Both purposes are described in CLSI EP33, second edition (2023) [1].
The difficulty is that the same alert can arise from either situation.
A sudden platelet reduction may reflect true thrombocytopenia. It may also result from platelet aggregation, partial clotting or an incorrectly identified specimen.
The delta check cannot distinguish these possibilities on its own.
Most alerts do not reveal a laboratory error
A national survey of clinical laboratories in China identified treatment-related changes and changes in patient physiology among the common explanations for delta alerts. Frequently, no laboratory problem was identified and results were released [2].
Kim and colleagues evaluated CBC delta-check methods and reported that 1.7% of results exceeded their selected criteria. Retesting occurred in 0.5% and resampling in 0.001% of results [3].
These figures describe investigation activity, not confirmed error rates.
Nevertheless, they illustrate why automatically recollecting every specimen that fails a delta check would be inappropriate.
An alert is a reason to examine the evidence, not an instruction to reject the result.
Three concepts should also remain separate:
- Delta check limit: A threshold used to identify an unexpected change between sequential results.
- Reference Change Value (RCV): An estimate of change beyond expected analytical and within-person biological variation under defined assumptions.
- Critical value: A result requiring urgent clinical notification according to the laboratory’s established policy.
They serve different purposes [4,5].
Applying more delta rules does not necessarily improve the verification process. Including additional tests in a panel can increase the number of alerts and unnecessary investigations [6].
The aim is not to generate as many warnings as possible.
It is to identify changes that deserve attention without overwhelming the laboratory with alerts of limited value.
3. Measuring the Change
Several approaches can describe the difference between sequential results.
For our platelet example:
Absolute change
Current result − Previous result
81 − 243 = −162 ×10³/µL
Percentage change
[(Current − Previous) / Previous] × 100
[(81 − 243) / 243] × 100 = −66.7%
The platelet count has fallen by approximately two-thirds of its previous value.
Why the time interval matters
A 66.7% fall over 24 hours does not have the same clinical implications as the same overall fall occurring over seven days.
A simple time-normalised percentage change illustrates the difference.
| Hypothetical interval | Total change | Average change per day |
|---|---|---|
| 24 hours | −66.7% | −66.7%/day |
| 7 days | −66.7% | Approximately −9.5%/day |
These are arithmetic comparisons, not evidence of a linear physiological decline. They are also distinct from the DPC/RR rate method evaluated by Kim and colleagues [3].
The interval helps us judge whether the change is clinically plausible.
However, time normalisation does not necessarily improve a delta rule’s ability to detect laboratory errors.
Tan and colleagues found no universally optimal delta-check interval across the analytes studied, although parameter-specific exceptions were observed [7].
Clinical plausibility and statistical error-detection performance are not the same thing.
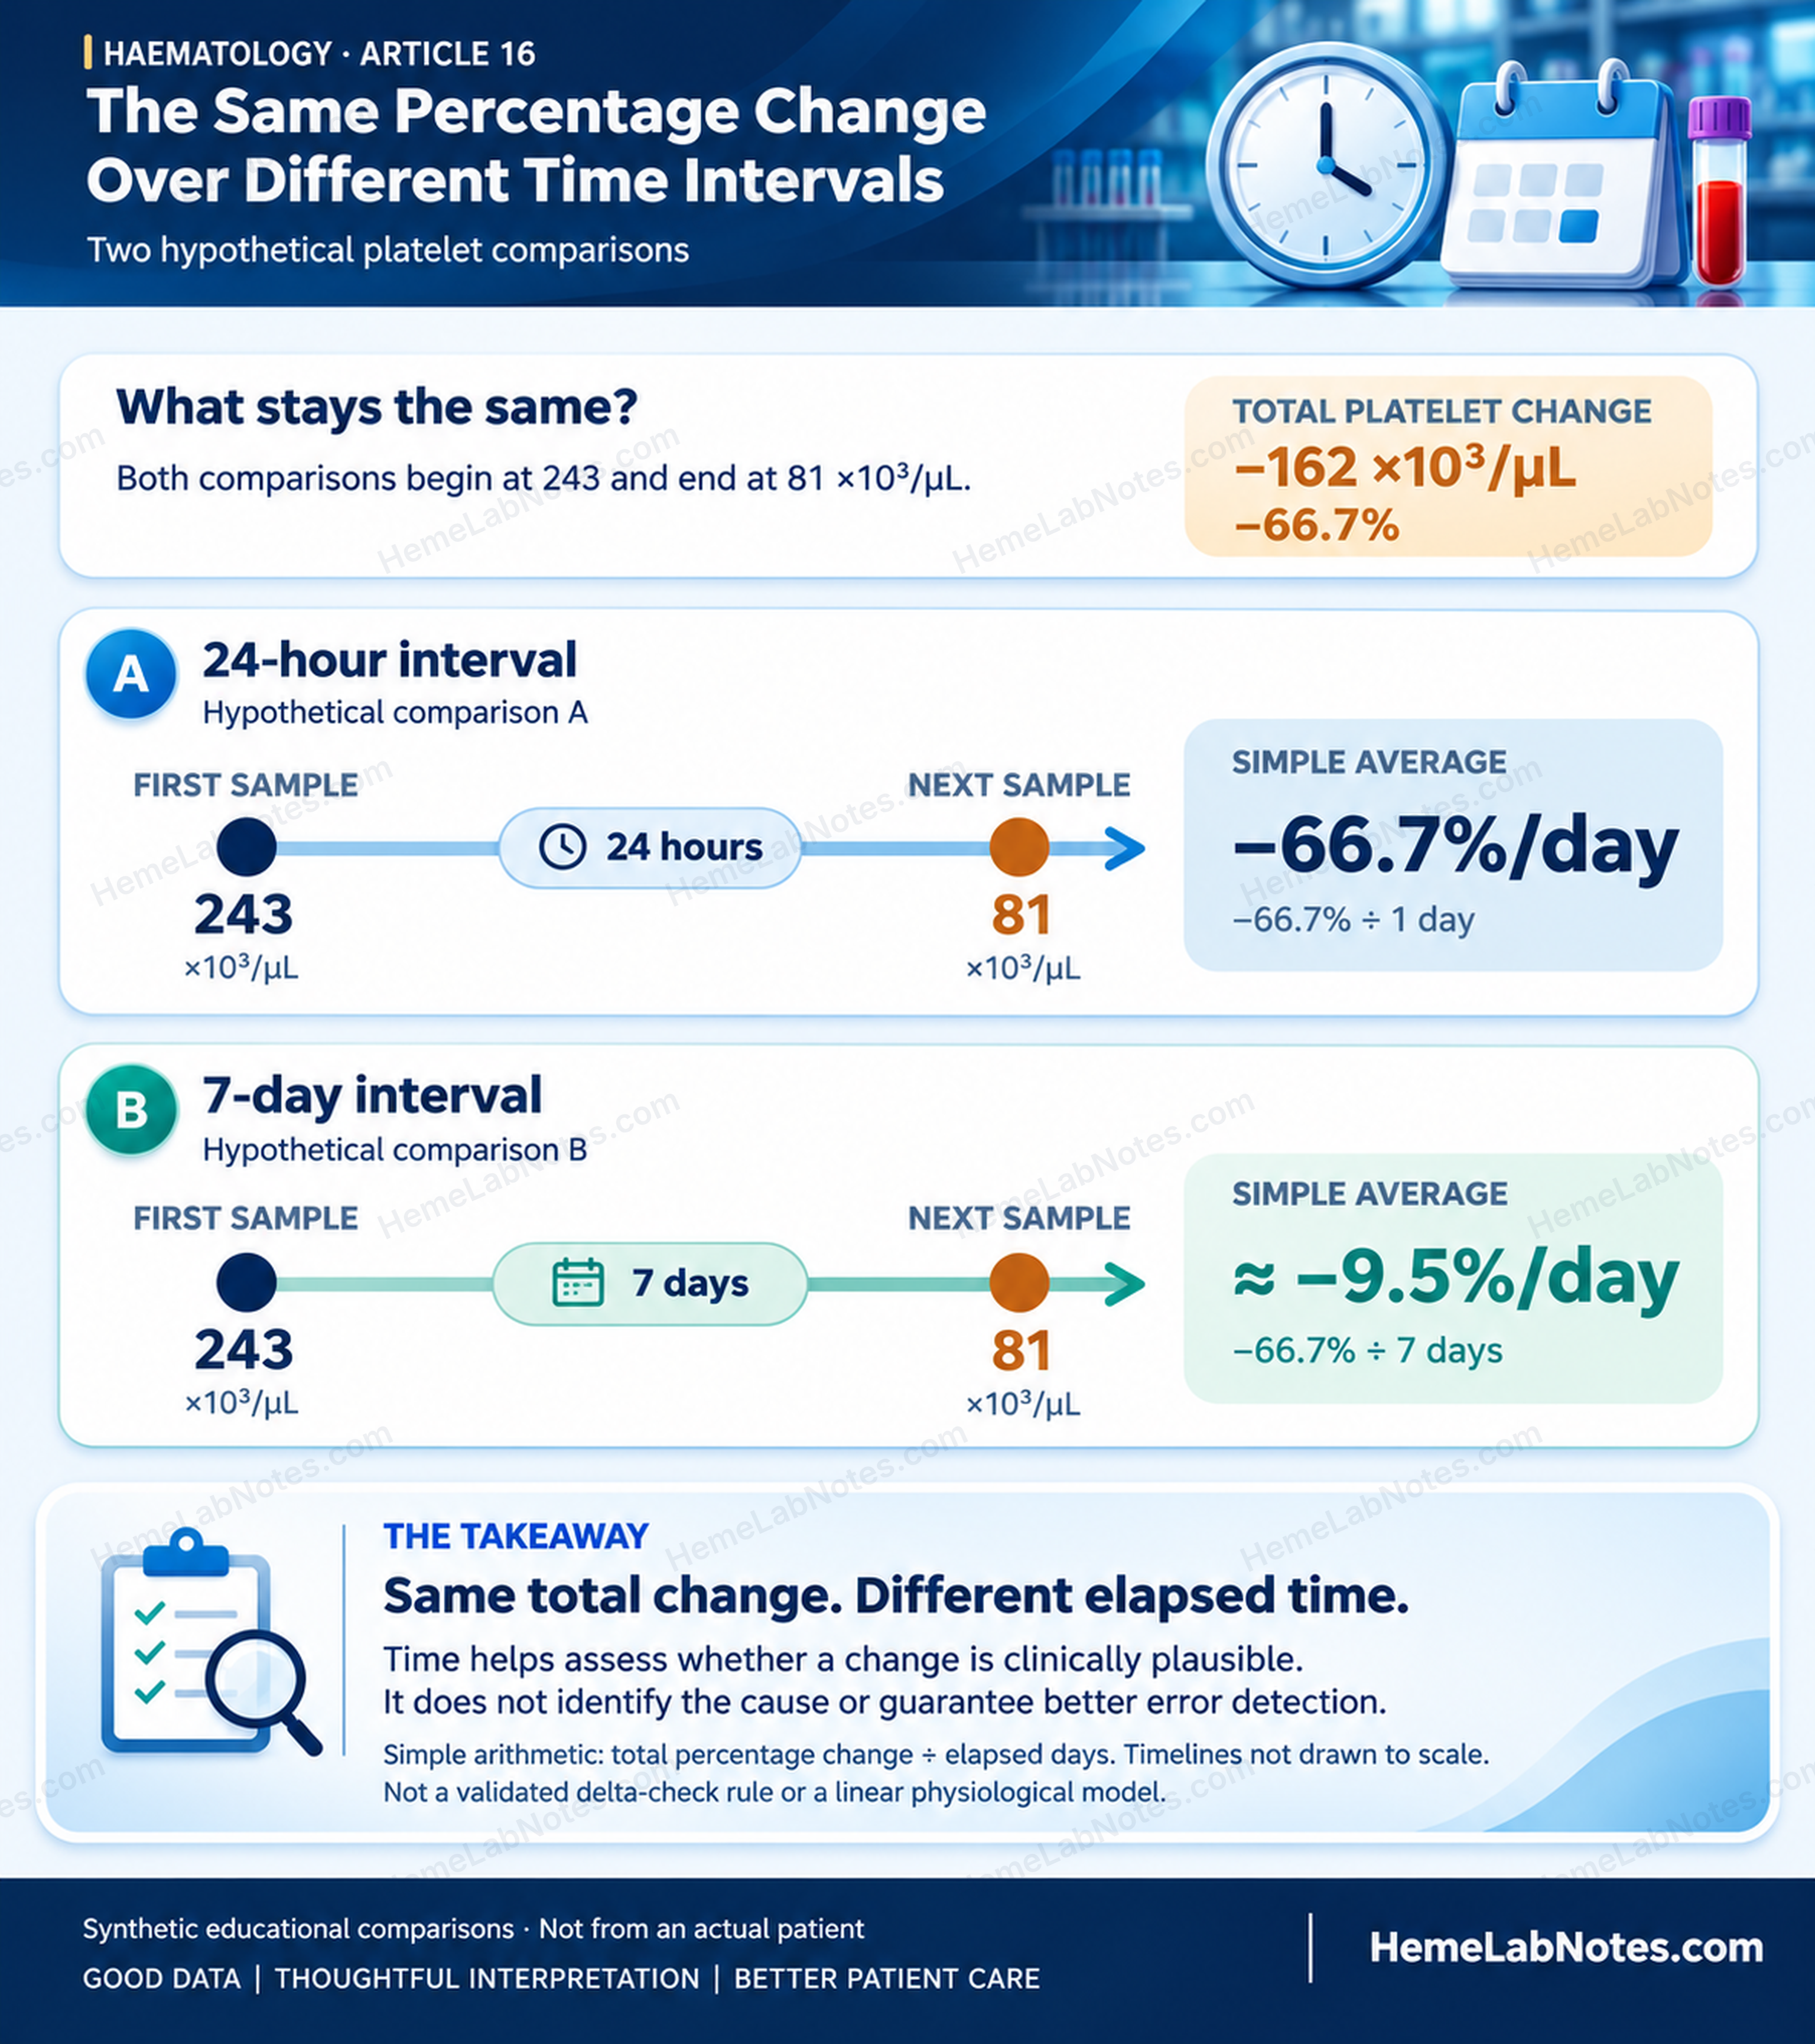
Two hypothetical platelet reductions of 66.7%, occurring over 24 hours and seven days, produce different arithmetic rates of change. The comparison illustrates the importance of time in clinical interpretation without implying linear physiological change or improved error detection.
View full size4. Reading the Pattern
When a CBC changes unexpectedly, the individual delta is only part of the information available.
The relationship between parameters can be equally informative.
In our opening case, WBC, RBC, Hb and MCV remain relatively stable, while the platelet count falls sharply.
This directs attention towards the platelet result, but it does not establish whether the reduction is genuine.
When several cell counts fall together
A specimen contaminated by intravenous fluid may show dilution of several cellular components.
RBC, WBC and platelet counts may decrease together, while red-cell indices remain relatively stable.
This pattern should raise suspicion of dilution, particularly when collection occurred near an infusion site.
But genuine clinical changes can produce similar findings.
The pattern is a clue, not proof.
A single-parameter delta rule may also miss a specimen problem if the affected parameter does not cross its selected limit.
When platelets fall but other parameters remain stable
An isolated platelet reduction raises several possibilities: genuine thrombocytopenia, platelet aggregation, partial clotting, platelet satellitism and other counting interferences.
Depending on the method, platelet aggregates may be excluded from the platelet counting range or registered incorrectly. Some aggregates can also contribute to apparent WBC abnormalities.
A stable WBC count therefore does not exclude clumping.
Neither does the absence of a platelet-clump flag.
Flag generation depends on the analyser, measurement method and specimen characteristics [8,9].
When aggregation is suspected, the blood film provides essential morphological evidence.
When MCV changes unexpectedly
MCV is often relatively stable within an individual over short periods.
An abrupt, unexplained change should prompt specimen identity verification and review of possible interferences.
Cold agglutination may cause falsely increased MCV, reduced RBC count and abnormal red-cell indices.
Marked hyperglycaemia-related measurement effects, prolonged storage and genuine changes in the red-cell population are other considerations.
For further discussion, see H14 — Cold Agglutination on the CBC: When the Numbers Stop Agreeing.
When several parameters change unexpectedly
Multiple unexplained changes should raise concern about specimen identity, specimen compromise or a genuine clinical event.
Wrong blood in tube (WBIT) is an important possibility.
However, abnormal CBC parameters are not necessarily independent findings.
Consider the familiar mathematical relationships:
- Hct (%) = RBC (×10⁶/µL) × MCV (fL) / 10
- MCH (pg) = Hb (g/dL) × 10 / RBC (×10⁶/µL)
- MCHC (g/dL) = Hb (g/dL) × 100 / Hct (%)
These indices are mathematically linked. Which values are measured and which are calculated depends on the analyser.
For example, the Sysmex XN-Series uses cumulative RBC pulse-height information to determine Hct. In contrast, the Beckman Coulter DxH 520 derives MCV from the RBC histogram and calculates Hct from RBC and MCV [10,11].
A disturbance affecting an underlying measurement can therefore influence several reported parameters.
Multiple abnormal CBC values do not necessarily represent multiple independent pieces of evidence.
That is why we read the relationship between results, rather than simply counting how many parameters have changed.
5. Investigating a Delta Alert at the Bench
A useful investigation begins with a practical question:
What evidence would help us decide whether this result can be trusted?
The appropriate response depends on the suspected problem, available evidence and laboratory SOP. The usefulness of a delta rule ultimately depends on its ability to support meaningful investigations in the laboratory where it is applied [12].
Step 1 — Verify the comparison
Start with patient identification and result history.
Do both results belong to the same patient?
Were the collection dates and times recorded correctly?
Were comparable analytical methods used?
Could treatment, transfusion or another clinical event explain the difference?
An incorrect previous result or specimen mismatch can make a mathematically correct delta misleading.
Step 2 — Assess specimen integrity
Review collection and handling.
Was the tube correctly filled and mixed? Was collection difficult? Are fibrin strands or microclots present?
Could intravenous fluid contamination have occurred?
How long was the specimen stored before analysis?
A partially clotted EDTA specimen is not equivalent to EDTA-dependent pseudothrombocytopenia.
If fibrin or microclots compromise specimen validity, recollection of an appropriate specimen is required.
EDTA-dependent PTCP, by contrast, involves in-vitro platelet aggregation and may require an alternative anticoagulant or another validated counting procedure [8,9].
Step 3 — Review analyser evidence
Check the relevant flags, histograms, scattergrams and available counting methods.
An abnormal impedance platelet histogram may suggest aggregation even when no platelet-clump flag appears.
One published set of national recommendations includes a platelet reduction of at least 40% among its criteria for investigating suspected PTCP [9].
Our simulated fall of 66.7% exceeds that criterion.
However, 40% is a published review threshold, not a universal delta limit or diagnostic cut-off.
Optical or fluorescence platelet counting, including PLT-F where available, may improve some spuriously low platelet results.
Such methods can provide useful additional evidence. They cannot independently establish that platelet aggregation is absent [8,9].
Step 4 — Examine the blood film and CBC pattern
The blood film may reveal platelet aggregates, satellitism, abnormal platelet size or other findings not apparent from the numerical result.
Examine related CBC parameters and calculated indices.
Do they support the suspected explanation?
If repeat analysis is performed, remember that a reproducible result is not automatically valid.
Repeating an affected specimen may reproduce the same interference.
A repeat is most useful when it adds evidence rather than merely another number.
Step 5 — Correlate with clinical information
Further review reveals that our simulated patient has received prophylactic low-molecular-weight heparin (LMWH) since Day 0.
This introduces the possibility of heparin-induced thrombocytopenia (HIT).
But it does not establish that the platelet reduction is genuine.
PTCP can first become apparent during hospitalisation [13,14]. Observational studies have also reported associations between PTCP, hospitalisation and LMWH exposure, without establishing causation [8].
The potential for misinterpretation is not merely theoretical.
In Berkman and colleagues’ clinical series, one patient’s apparent thrombocytopenia was attributed to heparin, leading to a reduction in heparin dosage before PTCP was recognised [14].
This illustrates why an apparent platelet fall should be assessed for interference before attributing it to a medication-related complication.
Clinical information can support competing explanations.
The laboratory must first determine whether the platelet count is reliable.
Step 6 — Decide what can safely be reported
The final action depends on the evidence.
A verified result may be released, with clinical communication when appropriate.
An unreliable parameter should be withheld or replaced using a validated alternative measurement.
An unsuitable specimen may require recollection.
A clinically important confirmed change may require prompt escalation under the laboratory’s notification policy.
The decision and supporting evidence should be documented.
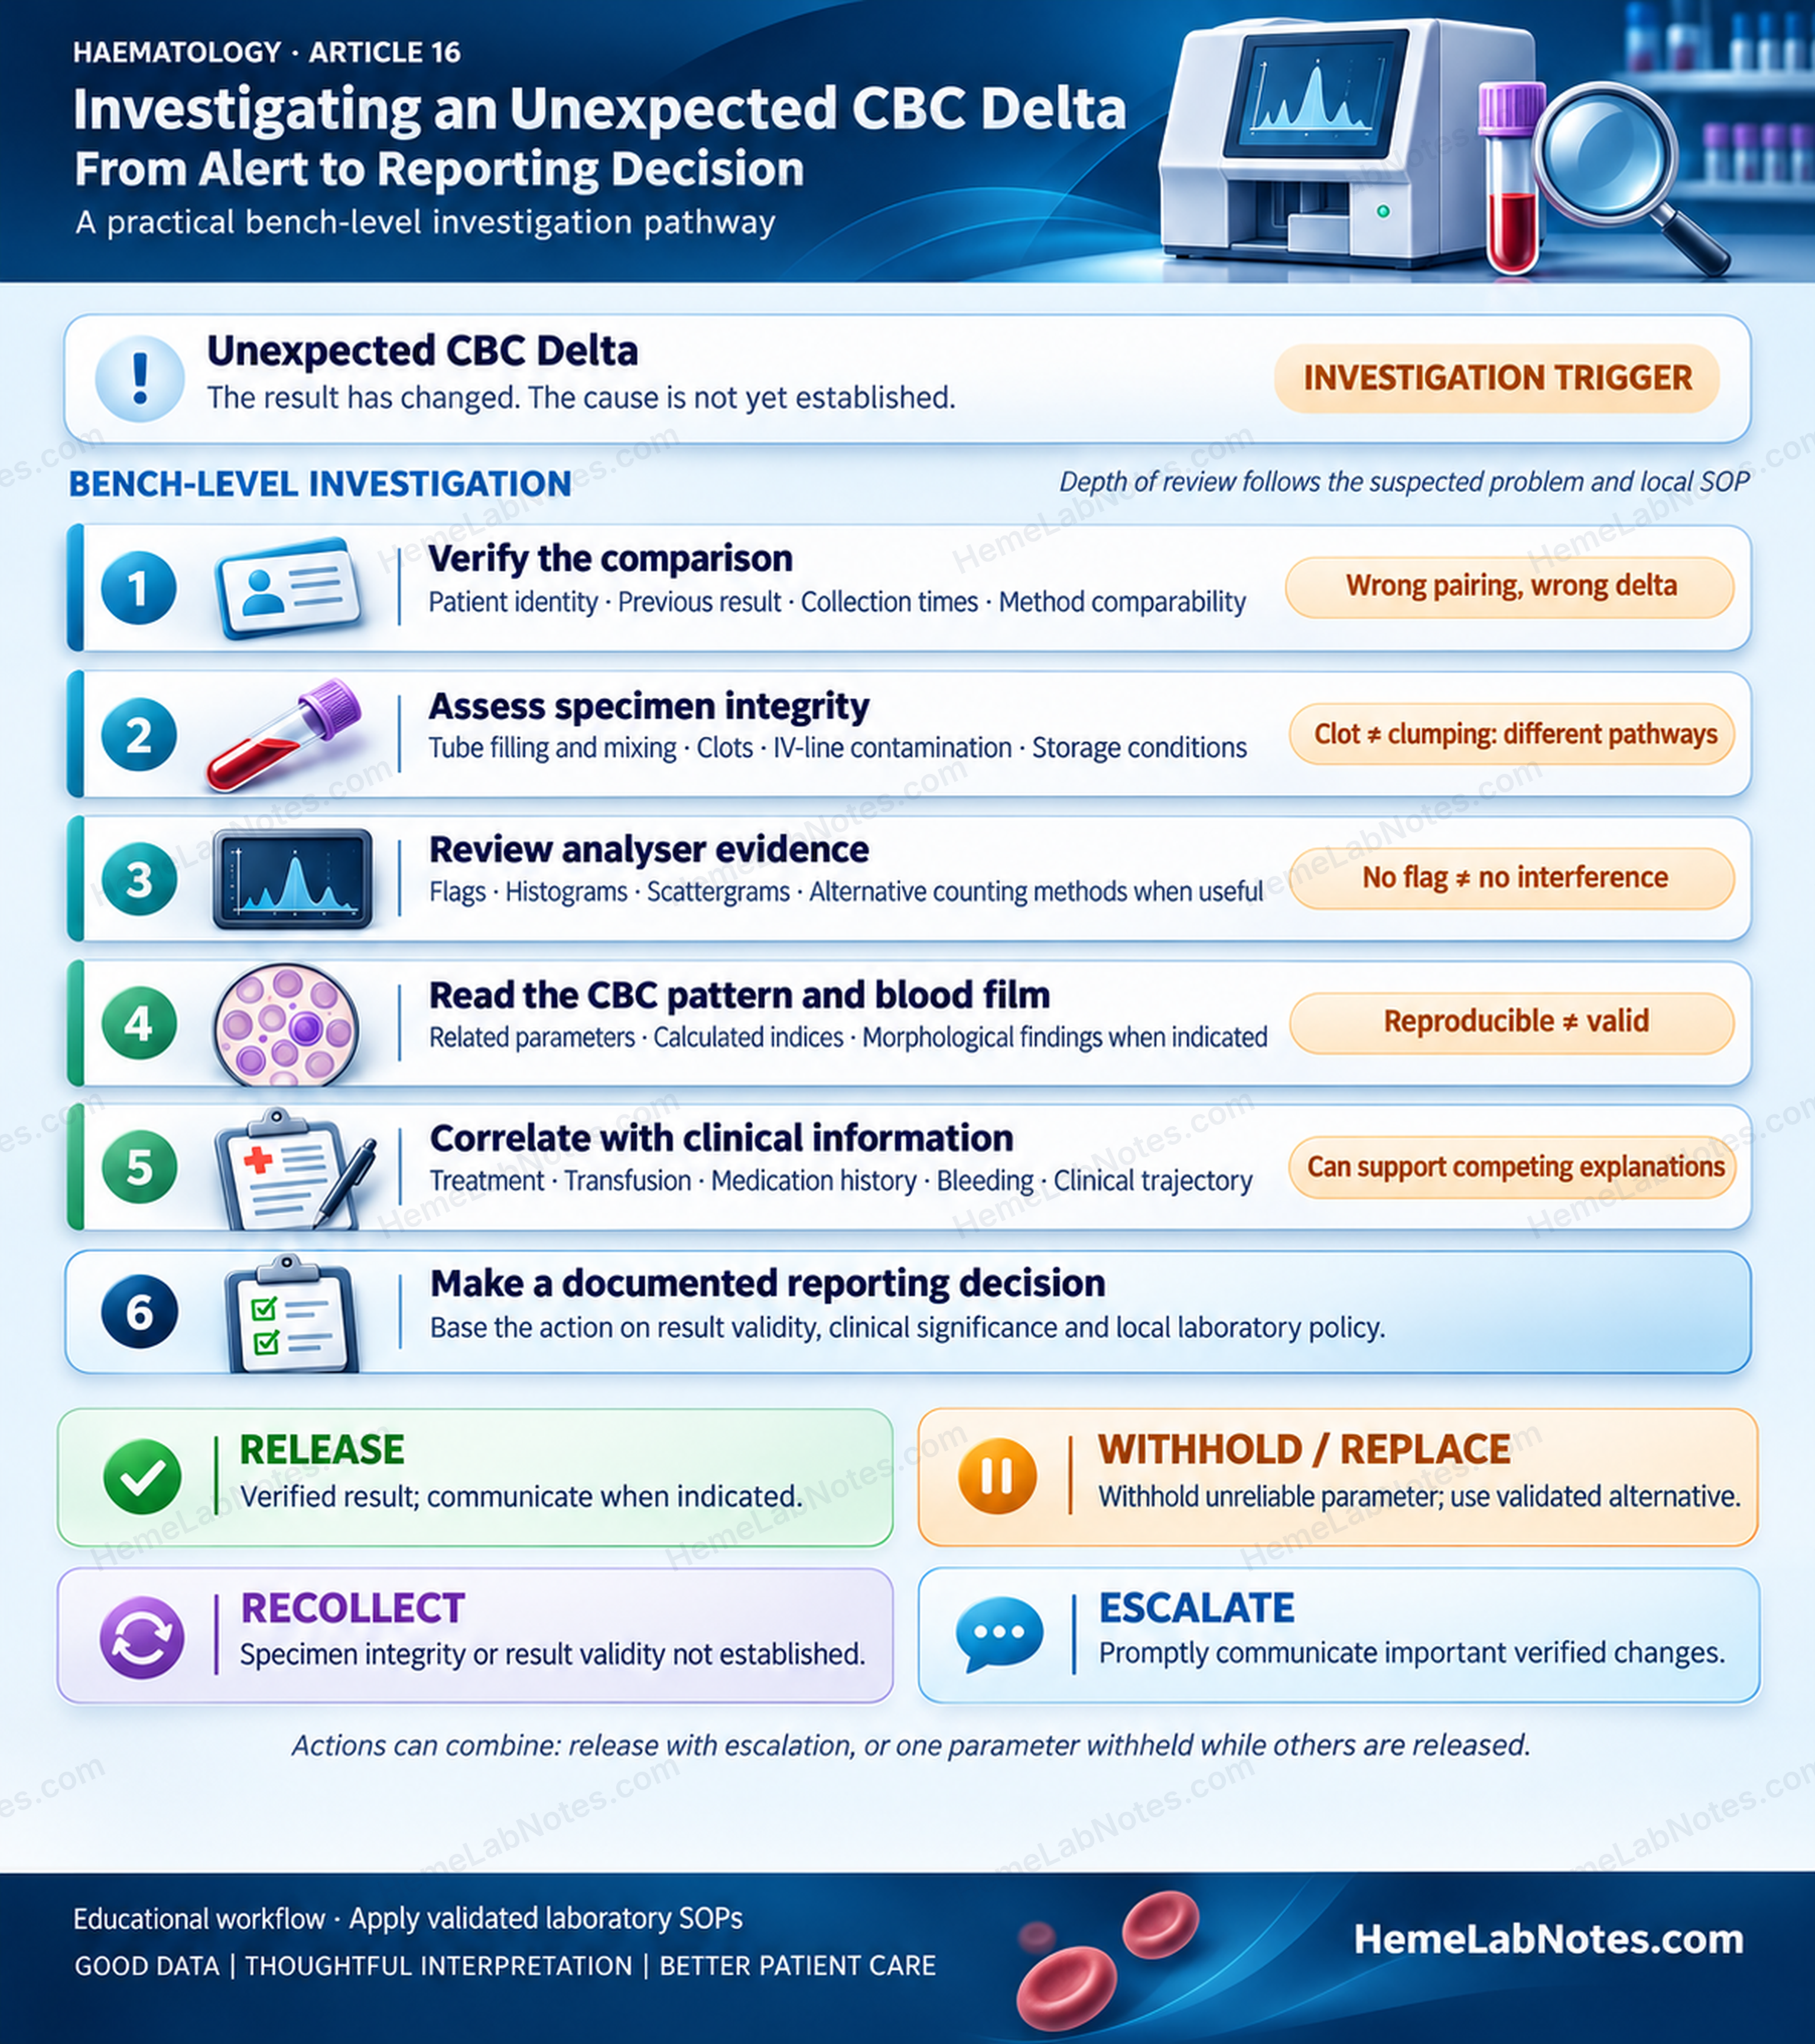
A bench-level investigation integrates result comparison, specimen integrity, analyser evidence, blood-film examination and clinical information. Reporting decisions depend on the reliability of the affected result and the significance of the confirmed change.
View full size6. Where Your Lab’s Delta Limits Come From
Delta-check limits should be appropriate for the laboratory using them.
Some laboratories adopt published criteria or professional recommendations. Others use Reference Change Value (RCV), expert consensus or local patient data.
Each approach has limitations.
RCV considers analytical and within-person biological variation. It can help evaluate whether a change exceeds expected variation under defined assumptions.
But an RCV-based limit is not automatically an effective specimen-error detection rule.
Similarly, a limit established in one laboratory may perform differently elsewhere.
Markus and colleagues emphasised evaluating delta rules against their intended detection purpose and actual performance [12].
Why patient populations matter
Inpatients may undergo frequent testing and substantial treatment-related changes.
Outpatients often have different testing intervals and patterns of biological variation.
Kim and colleagues found that their CBC delta criteria differed between inpatient and outpatient populations [3].
This supports considering separate criteria where justified, rather than assuming one set of limits is appropriate for every setting.
Balancing alert workload and error detection
A narrow limit may detect more changes while generating more investigations.
A wider limit may reduce unnecessary alerts but miss some important problems.
The questions are practical:
How often does the rule trigger?
How frequently does investigation identify a genuine error?
What might be missed, and what are the consequences?
Delta checks and patient moving averages are complementary patient-based quality tools. Delta checks examine individual patients, whereas moving averages monitor patterns across patient populations.
The latter are discussed in QC06 — Patient-Based Quality Control in Haematology.
Detailed development and validation of delta limits deserve a separate QC Series article.
Here, our concern is what happens after an alert appears.
7. Release, Investigate or Recollect?
Return to the patient whose platelet count fell from 243 to 81 ×10³/µL.
The initial CBC results and clinical timeline are identical in the two hypothetical outcomes below.
Only the evidence obtained during investigation changes.
These are alternative educational scenarios, not two simultaneous outcomes in the same patient.
Branch A — The platelet count is unreliable
The EDTA blood film reveals platelet aggregates.
Tube inspection shows no fibrin or microclots.
A newly collected, correctly filled 3.2% sodium citrate specimen is analysed. Blood-film review shows no platelet aggregation in this alternative specimen.
The citrate platelet count is 216 ×10³/µL.
Using the simulated laboratory’s validated dilution correction factor:
Corrected citrate PLT = 216 × 1.10 = 237.6 ≈ 238 ×10³/µL
This is consistent with the previous day’s EDTA count of 243 ×10³/µL.
The original EDTA result of 81 ×10³/µL is unreliable and should not be released as a valid platelet count.
Affected platelet-related indices, including EDTA MPV, should also be withheld. Other CBC parameters may be reported once their reliability has been established [9].
An appropriate report comment might read:
Platelet aggregates were observed in the EDTA specimen. The platelet count was obtained from a citrate-anticoagulated specimen and corrected for dilution using the laboratory’s validated procedure.
Citrate correction is method-dependent. Aggregation may persist with citrate or other anticoagulants, in which case further validated counting approaches may be necessary [8,9].
But another question remains.
Why was the Day 5 EDTA count apparently acceptable when the Day 6 count was affected?
Edelman and Kickler described a trauma patient in whom EDTA-associated platelet aggregation became apparent approximately one week after hospitalisation. Anti-platelet antibody was initially not detected but subsequently increased in titre [13].
The patient already had mild thrombocytopenia on admission. The case does not demonstrate a normal admission platelet count.
An apparently reliable earlier EDTA count therefore does not guarantee that the next specimen will be unaffected.
In our simulated case, the agreement between 238 and 243 ×10³/µL supports the interpretation. It cannot retrospectively prove that the earlier measurement was completely free from interference.
The reporting decision is to withhold the unreliable EDTA platelet result, release the validated alternative count and document the interference according to laboratory policy.
Branch B — The platelet reduction is genuine
Now consider a different outcome.
The specimen contains no clot. Blood-film examination reveals no platelet aggregates or satellitism, and the platelet estimate supports a low count.
Repeat analysis and an appropriate alternative counting method produce concordant low results.
The laboratory has reasonable evidence that the reduction is genuine.
The patient has received prophylactic LMWH since Day 0, with the platelet fall identified on Day 6.
The timing is compatible with typical-onset HIT.
The observed fall exceeds 50%, with a nadir above 20 ×10³/µL. These findings are relevant to the thrombocytopenia and timing components of the 4Ts assessment [15,16].
However, the available CBC results do not provide the complete platelet history or the clinical information needed to assess thrombosis and alternative causes.
A reliable overall 4Ts score cannot be established from these data alone.
Neither can HIT be diagnosed from the delta.
Postoperative studies have generally found lower HIT risk with LMWH than with unfractionated heparin [17,18]. In non-surgical populations, available evidence suggests low and potentially similar rates, although estimates are less certain [19].
These population-specific findings cannot determine the risk for our unspecified inpatient.
The laboratory’s responsibility is to release the verified platelet result and promptly communicate the significant change according to local policy.
The clinical team must assess the patient, complete the 4Ts evaluation and decide whether PF4/heparin antibody testing or further management is indicated [15].
One further distinction matters.
In real patients, platelet aggregation and genuine thrombocytopenia are not necessarily mutually exclusive. Finding interference does not remove the need to investigate a clinical concern when other evidence supports it.
What the two outcomes teach us
In Branch A, the apparent platelet fall is primarily an analytical artefact. The original result is withheld, and a validated alternative count is reported.
In Branch B, the platelet reduction is genuine. The verified result is released and promptly communicated because it may be clinically important.
Both investigations began with the same −66.7% delta.
The alert could not distinguish them.
The evidence did.
A reliable result is not necessarily an expected result. An unexpected result is not necessarily an unreliable one.
The delta check identifies the change.
The investigation determines what that change means.
References
-
CLSI. Use of Delta Checks in the Medical Laboratory. 2nd ed. CLSI guideline EP33. Clinical and Laboratory Standards Institute; 2023. https://clsi.org/shop/standards/ep33/
-
He S, Kang F, Wang W, Chen B, Wang Z. National survey on delta checks in clinical laboratories in China. Clin Chem Lab Med. 2020;58(4):569–576. https://doi.org/10.1515/cclm-2019-1131
-
Kim MS, Park CJ, Namgoong S, Kim SI, Cho YU, Jang S. Effective and practical complete blood count delta check method and criteria for the quality control of automated hematology analyzers. Ann Lab Med. 2023;43(5):418–424. https://doi.org/10.3343/alm.2023.43.5.418
-
Loh TP, Tan RZ, Sethi SK, Lim CY, Markus C. Delta checks. Adv Clin Chem. 2023;115:175–203. https://doi.org/10.1016/bs.acc.2023.03.005
-
Randell EW, Yenice S. Delta checks in the clinical laboratory. Crit Rev Clin Lab Sci. 2019;56(2):75–97. https://doi.org/10.1080/10408363.2018.1540536
-
Tan RZ, Markus C, Loh TP. An approach to optimize delta checks in test panels—the effect of the number of rules included. Ann Clin Biochem. 2020;57(3):215–222. https://doi.org/10.1177/0004563220904749
-
Tan RZ, Markus C, Loh TP. Impact of delta check time intervals on error detection capability. Clin Chem Lab Med. 2020;58(3):384–389. https://doi.org/10.1515/cclm-2019-1004
-
Lardinois B, Favresse J, Chatelain B, Lippi G, Mullier F. Pseudothrombocytopenia—a review on causes, occurrence and clinical implications. J Clin Med. 2021;10(4):594. https://doi.org/10.3390/jcm10040594
-
Milevoj Kopčinović L, Juričić G, Antončić D, et al. National recommendations of the Croatian Chamber of Medical Biochemists and Working group for Laboratory hematology of the Croatian Society of Medical Biochemistry and Laboratory Medicine: Management of samples with suspected EDTA-induced pseudothrombocytopenia. Biochem Med (Zagreb). 2024;34(3):030504. https://doi.org/10.11613/BM.2024.030504
-
Sysmex America, Inc. XN-Series Automated Hematology Analyzers: More Than Just a CBC—Automated NRBC Counts with Every Result. CF-08906, Rev. 1. Sysmex America; 2025. https://www.sysmex.com/-/media/project/sysmex/sysmex/documents/brochures/more-than-just-a-cbc--nrbc-with-every-result.pdf?sc_lang=en-us
-
Beckman Coulter. Performing Complete Blood Count with WBC Differential on the DxH 520 Analyzer. SOPDXH520_C41838AB. Beckman Coulter; 2019. https://www.beckmancoulter.com/download/file/wsr-293747/SOP_C41838AB?type=pdf
-
Markus C, Tan RZ, Loh TP. Evidence-based approach to setting delta check rules. Crit Rev Clin Lab Sci. 2021;58(1):49–59. https://doi.org/10.1080/10408363.2020.1800585
-
Edelman B, Kickler T. Sequential measurement of anti-platelet antibodies in a patient who developed EDTA-dependent pseudothrombocytopenia. Am J Clin Pathol. 1993;99(1):87–89. https://doi.org/10.1093/ajcp/99.1.87
-
Berkman N, Michaeli Y, Or R, Eldor A. EDTA-dependent pseudothrombocytopenia: a clinical study of 18 patients and a review of the literature. Am J Hematol. 1991;36(3):195–201. https://doi.org/10.1002/ajh.2830360307
-
Cuker A, Arepally GM, Chong BH, et al. American Society of Hematology 2018 guidelines for management of venous thromboembolism: heparin-induced thrombocytopenia. Blood Adv. 2018;2(22):3360–3392. https://doi.org/10.1182/bloodadvances.2018024489
-
Lo GK, Juhl D, Warkentin TE, Sigouin CS, Eichler P, Greinacher A. Evaluation of pretest clinical score (4 T’s) for the diagnosis of heparin-induced thrombocytopenia in two clinical settings. J Thromb Haemost. 2006;4(4):759–765. https://doi.org/10.1111/j.1538-7836.2006.01787.x
-
Junqueira DR, Zorzela LM, Perini E. Unfractionated heparin versus low molecular weight heparins for avoiding heparin-induced thrombocytopenia in postoperative patients. Cochrane Database Syst Rev. 2017;4(4):CD007557. https://doi.org/10.1002/14651858.CD007557.pub3
-
Martel N, Lee J, Wells PS. Risk for heparin-induced thrombocytopenia with unfractionated and low-molecular-weight heparin thromboprophylaxis: a meta-analysis. Blood. 2005;106(8):2710–2715. https://doi.org/10.1182/blood-2005-04-1546
-
Locke CFS, Dooley J, Gerber J. Rates of clinically apparent heparin-induced thrombocytopenia for unfractionated heparin vs. low molecular weight heparin in non-surgical patients are low and similar. Thromb J. 2005;3:4. https://doi.org/10.1186/1477-9560-3-4
HemeLabNotes provides practical educational material for laboratory professionals. Specimen investigation, result verification and reporting decisions should follow validated laboratory methods, applicable standards and clinical context.